2023 Warwick District Council election
The 2023 Warwick District Council election took place on 4 May 2023 to elect members of Warwick District Council in Warwickshire, England.[2] This took place on the same day as other local elections in England. The council remained without control of any party.
| |||||||||||||||||||||||||||||||||||||||||||||||||||||||||||||||||||||||||||||
All 44 seats to Warwick District Council 23 seats needed for a majority | |||||||||||||||||||||||||||||||||||||||||||||||||||||||||||||||||||||||||||||
|---|---|---|---|---|---|---|---|---|---|---|---|---|---|---|---|---|---|---|---|---|---|---|---|---|---|---|---|---|---|---|---|---|---|---|---|---|---|---|---|---|---|---|---|---|---|---|---|---|---|---|---|---|---|---|---|---|---|---|---|---|---|---|---|---|---|---|---|---|---|---|---|---|---|---|---|---|---|
| |||||||||||||||||||||||||||||||||||||||||||||||||||||||||||||||||||||||||||||
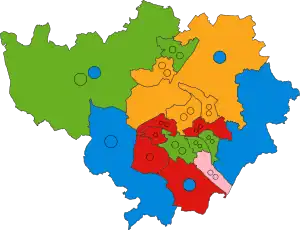 Winner of each seat at the 2023 Warwick District Council election | |||||||||||||||||||||||||||||||||||||||||||||||||||||||||||||||||||||||||||||
 Composition of the council after the election | |||||||||||||||||||||||||||||||||||||||||||||||||||||||||||||||||||||||||||||
| |||||||||||||||||||||||||||||||||||||||||||||||||||||||||||||||||||||||||||||
Summary
Election result
| 2023 Warwick District Council election | ||||||||||
|---|---|---|---|---|---|---|---|---|---|---|
| Party | Candidates | Seats | Gains | Losses | Net gain/loss | Seats % | Votes % | Votes | +/− | |
| Green | 37 | 14 | 26.3 | 27,789 | ||||||
| Labour | 30 | 11 | 21.4 | 22,642 | ||||||
| Liberal Democrats | 41 | 10 | 18.1 | 19,061 | ||||||
| Conservative | 44 | 6 | 30.5 | 32,181 | ||||||
| Whitnash Residents | 3 | 3 | 3.4 | 3,587 | ||||||
| Heritage | 1 | 0 | 0.1 | 116 | ||||||
| Reform UK | 1 | 0 | 0.1 | 73 | ||||||
| UKIP | 1 | 0 | 0.1 | 122 | ||||||
Candidates
Bishop's Tachbrook
| Party | Candidate | Votes | % | ±% | |
|---|---|---|---|---|---|
| Labour | Matt Collins | 676 | 22.4 | ||
| Conservative | Andrew Day* | 668 | 22.1 | 27.3 | |
| Labour | Deirdre Fox | 663 | 21.9 | ||
| Conservative | Matthew Greene | 627 | 20.7 | ||
| Green | Janet Alty | 161 | 5.3 | ||
| Green | Darren Skilton | 105 | 3.5 | ||
| Liberal Democrats | Nicola Lomas | 65 | 2.2 | ||
| Liberal Democrats | Kelvin Lambert | 59 | 2 | ||
| Majority | 5 | 0.2 | |||
| Turnout | 1,561 | 33.3 | |||
| Registered electors | 4,681 | ||||
| Conservative hold | |||||
| Labour win (new seat) | |||||
Budbrooke
| Party | Candidate | Votes | % | ±% | |
|---|---|---|---|---|---|
| Conservative | Jan Matecki* | 905 | 22.8 | 26.0 | |
| Conservative | Peter Phillips | 864 | 21.8 | ||
| Labour | John Barrott | 806 | 20.3 | ||
| Liberal Democrats | Gerry Jackson | 749 | 18.9 | ||
| Green | Sara Lever | 349 | 8.8 | ||
| Green | John Dearing | 300 | 7.6 | ||
| Majority | 58 | 1.5 | |||
| Turnout | 2,188 | 42.1 | |||
| Registered electors | 5,191 | ||||
| Conservative hold | |||||
| Conservative hold | |||||
Cubbington & Leek Wootton
| Party | Candidate | Votes | % | ±% | |
|---|---|---|---|---|---|
| Liberal Democrats | Josh Payne | 697 | 21.5 | ||
| Conservative | Pamela Redford* | 633 | 19.5 | 32.3 | |
| Conservative | Trevor Wright* | 615 | 18.9 | 32.5 | |
| Liberal Democrats | Justine Ragany | 608 | 18.7 | ||
| Labour | John Roberts | 307 | 9.5 | ||
| Green | Elizabeth Beattie | 201 | 6.2 | ||
| Green | Amanda Bryant | 187 | 5.8 | ||
| Majority | 18 | 0.5 | |||
| Turnout | 1,702 | 38.1 | |||
| Registered electors | 4,471 | ||||
| Conservative hold | |||||
| Liberal Democrats win (new seat) | |||||
Kenilworth Abbey & Arden
| Party | Candidate | Votes | % | ±% | |
|---|---|---|---|---|---|
| Green | David Armstrong | 1,597 | 16.9 | ||
| Green | Kyn Aizlewood | 1,535 | 16.2 | ||
| Conservative | Richard Hales* | 1,292 | 13.6 | 35.4 | |
| Green | John Watson | 1,275 | 13.5 | ||
| Conservative | John Cooke* | 1,262 | 13.3 | 35.1 | |
| Conservative | Janet Gee | 1,230 | 13.0 | ||
| Liberal Democrats | Annabell Gurney-Terry | 349 | 3.7 | ||
| Liberal Democrats | Ederyn Williams | 345 | 3.6 | ||
| Labour | Hannah Deacon | 307 | 3.2 | ||
| Liberal Democrats | Timothy Macy | 285 | 3.0 | ||
| Majority | 17 | 0.5 | |||
| Turnout | 3,322 | 39.5 | |||
| Registered electors | 8,411 | ||||
| Conservative hold | |||||
| Green win (new seat) | |||||
| Green win (new seat) | |||||
Kenilworth Park Hill
| Party | Candidate | Votes | % | ±% | |
|---|---|---|---|---|---|
| Conservative | Felicity Bunker | 971 | 10.57 | ||
| Conservative | Malcolm Graham | 1066 | 11.61 | ||
| Conservative | Frances Lasok | 846 | 9.21 | ||
| Green | Lara Cron | 1585 | 17.26 | ||
| Green | Alistair Kennedy* | 1838 | 20.01 | ||
| Green | Lowell Williams | 1333 | 14.51 | ||
| Labour | Jeremy Eastaugh | 491 | 5.35 | ||
| Liberal Democrats | Alan Chalmers | 404 | 4.4 | ||
| Liberal Democrats | Silvia Fuchss | 214 | 2.33 | ||
| Liberal Democrats | Adrian Marsh | 436 | 4.75 | ||
Kenilworth St. John's
| Party | Candidate | Votes | % | ±% | |
|---|---|---|---|---|---|
| Conservative | Andy Metcalf | ||||
| Conservative | Isabella Moore | ||||
| Conservative | Rik Spencer | ||||
| Green | Joe Rukin | ||||
| Labour | Peter Shiels | ||||
| Liberal Democrats | Kate Dickson* | ||||
| Liberal Democrats | Richard Dickson* | ||||
| Liberal Democrats | Andrew Milton* | ||||
Leamington Brunswick
| Party | Candidate | Votes | % | ±% | |
|---|---|---|---|---|---|
| Conservative | Jonathan Bateman | ||||
| Conservative | Tom Garth | ||||
| Conservative | Harry Jee | ||||
| Green | Jonathan Chilvers | ||||
| Green | Ian Davison* | ||||
| Green | Naveen Tangri* | ||||
| Labour | Jill Barker | ||||
| Labour | Maddy Kerr | ||||
| Labour | Jamie Sweeney | ||||
| Liberal Democrats | Perjit Aujla | ||||
| Liberal Democrats | Luke Dickinson | ||||
| Liberal Democrats | Josh Lucas Mitte | ||||
Leamington Clarendon
| Party | Candidate | Votes | % | ±% | |
|---|---|---|---|---|---|
| Conservative | Nathan Cox | 425 | 5.7 | ||
| Conservative | Nathan Stone | 409 | 5.49 | ||
| Conservative | Andrew Thompson | 482 | 6.47 | ||
| Green | Sarah Richards | 569 | 7.63 | ||
| Labour | Jessica Harrison | 1302 | 17.46 | ||
| Labour | Katie Hunt | 1480 | 19.85 | ||
| Labour | Christopher King* | 1427 | 19.14 | ||
| Liberal Democrats | David Alexander | 493 | 6.61 | ||
| Liberal Democrats | Peter Brown | 427 | 5.73 | ||
| Liberal Democrats | Blake Hutchings | 441 | 5.92 | ||
Leamington Lillington
| Party | Candidate | Votes | % | ±% | |
|---|---|---|---|---|---|
| Conservative | Philip Rothwell | ||||
| Conservative | David Stevens | ||||
| Conservative | Lewis Wakeford | ||||
| Green | Angela Smith | ||||
| Green | Tom Walton | ||||
| Green | Marcia Watson | ||||
| Heritage | Guy Chapman | ||||
| Labour | Anthony Murphy | ||||
| Labour | Stef Parkins | ||||
| Labour | Ruby Turok | ||||
| Liberal Democrats | Alan Boad* | ||||
| Liberal Democrats | Phil Kohler* | ||||
| Liberal Democrats | Daniel Russell* | ||||
Leamington Milverton
| Party | Candidate | Votes | % | ±% | |
|---|---|---|---|---|---|
| Conservative | Lauren Byrne | ||||
| Conservative | Hayley Key | ||||
| Conservative | Cory North | ||||
| Green | Joel Holmes | ||||
| Green | Chris Philpott | ||||
| Labour | Helen Adkins | ||||
| Labour | Susan Deeley | ||||
| Labour | Andy Marshall | ||||
| Liberal Democrats | Bill Gifford* | ||||
| Liberal Democrats | Carolyn Gifford* | ||||
| Liberal Democrats | Sidney Syson* | ||||
Leamington Willes
| Party | Candidate | Votes | % | ±% | |
|---|---|---|---|---|---|
| Conservative | Stacey Calder | ||||
| Conservative | Tom Chaloner | ||||
| Conservative | Caleb Heather | ||||
| Green | Ella Billiald | ||||
| Green | Martin Luckhurst* | ||||
| Green | Will Roberts* | ||||
| Labour | Krish Bhardwaj | ||||
| Liberal Democrats | Hugh Foden | ||||
| Liberal Democrats | Dan Naylor | ||||
| Liberal Democrats | Ajay Pandey | ||||
Radford Semele
| Party | Candidate | Votes | % | ±% | |
|---|---|---|---|---|---|
| Conservative | Becky Noonan | 435 | 40.1 | ||
| Liberal Democrats | Laurence Byrne | 398 | 36.7 | ||
| Labour | Linda Hugl | 147 | 13.6 | ||
| Green | Peggy Wiseman | 105 | 9.7 | ||
Warwick All Saints & Woodloes
| Party | Candidate | Votes | % | ±% | |
|---|---|---|---|---|---|
| Conservative | Moira-Ann Grainger* | ||||
| Conservative | Oliver Jacques* | ||||
| Conservative | Jody Tracey* | ||||
| Green | Tamsin Lewis | ||||
| Green | Juliet Nickels | ||||
| Labour | Raj King | ||||
| Labour | John Sullivan | ||||
| Labour | Paul Wightman | ||||
| Liberal Democrats | Monica Boynton | ||||
| Liberal Democrats | Andrew Cooper | ||||
Warwick Aylesford
| Party | Candidate | Votes | % | ±% | |
|---|---|---|---|---|---|
| Labour | Daniel Browne | 802 | 24.0 | ||
| Labour | Gabriel Rosu | 710 | 21.2 | ||
| Conservative | Liam Bartlett* | 617 | 18.5 | ||
| Conservative | Llywelyn Colnet | 557 | 16.7 | ||
| Green | Paul Atkins | 200 | 6.0 | ||
| Liberal Democrats | Fred Dahlmann | 171 | 5.1 | ||
| Liberal Democrats | Jennifer Boileau | 144 | 4.3 | ||
| Green | Tony O'Brien | 143 | 4.3 | ||
Warwick Myton & Heathcote
| Party | Candidate | Votes | % | ±% | |
|---|---|---|---|---|---|
| Conservative | Gareth Dore | ||||
| Conservative | Cameron Low | ||||
| Conservative | Neale Murphy* | ||||
| Green | Kathleen Gorman | ||||
| Green | Dominic Harrison | ||||
| Green | Hema Yellapragada | ||||
| Labour | Mini Mangat* | ||||
| Liberal Democrats | John Kelly | ||||
| Liberal Democrats | Michelle McHugh | ||||
| Liberal Democrats | Deborah Pittarello | ||||
| Reform UK | Malcolm Sedgley | ||||
Warwick Saltisford
| Party | Candidate | Votes | % | ±% | |
|---|---|---|---|---|---|
| Labour | Katya Dray | 968 | 26.5 | ||
| Labour | Jim Sinnott | 872 | 23.9 | ||
| Conservative | John Morley | 515 | 14.1 | ||
| Conservative | Hugh Herring | 513 | 14.1 | ||
| Green | Eloise Chilvers | 328 | 9.0 | ||
| Liberal Democrats | Christine Fell | 237 | 6.5 | ||
| Liberal Democrats | Alan Beddow | 218 | 6.0 | ||
Whitnash
| Party | Candidate | Votes | % | ±% | |
|---|---|---|---|---|---|
| Whitnash Residents | Adrian Barton | 1295 | 21.5 | ||
| Whitnash Residents | Judith Falp | 1284 | 21.4 | ||
| Whitnash Residents | Robert Margrave | 1008 | 16.8 | ||
| Labour | Felix Ling | 645 | 10.7 | ||
| Green | Vicky Clark | 316 | 5.3 | ||
| Green | Wendy Edwards | 264 | 4.4 | ||
| Liberal Democrats | Chris Walsh | 215 | 3.6 | ||
| Green | Bronwen Reid | 214 | 3.6 | ||
| Conservative | Jack Ahern | 187 | 3.1 | ||
| Conservative | Ethan Parmar | 161 | 2.7 | ||
| Conservative | Derek Moore | 159 | 2.6 | ||
| Liberal Democrats | James Jessamine | 142 | 2.4 | ||
| UKIP | Laurie Steele | 122 | 2.0 | ||
References
- "Political structure". Warwick District Council. Retrieved 2 May 2023.
- "Notice of election - District Councillors". Warwick District Council. 17 March 2023. Retrieved 21 April 2023.
- "Bishops's Tachbrook". Warwick District Council. Retrieved 5 May 2023.
- "Budbrooke". Warwick District Council. Retrieved 5 May 2023.
- "Cubbington & Leek Wootton". Warwick District Council. Retrieved 5 May 2023.
- "Kenilworth Abbey & Arden". Warwick District Council. Retrieved 5 May 2023.
- "Leamington Clarendon". Warwick District Council. Retrieved 5 May 2023.
- "Radford Semele". Warwick District Council. Retrieved 5 May 2023.
- "Warwick Aylesford". Warwick District Council. Retrieved 5 May 2023.
- "Warwick Myton & Heathcote". Warwick District Council. Retrieved 5 May 2023.
- "Warwick Saltisford". Warwick District Council. Retrieved 5 May 2023.
- "Whitnash". Warwick District Council. Retrieved 5 May 2023.
This article is issued from Wikipedia. The text is licensed under Creative Commons - Attribution - Sharealike. Additional terms may apply for the media files.