2023 Cheshire East Council election
Elections to Cheshire East Council took place on Thursday 4 May 2023 in all 52 wards, with each ward returning between one and three councillors to the council.
| |||||||||||||||||||||||||||||||||||||
All 82 seats to Cheshire East Council 42 seats needed for a majority | |||||||||||||||||||||||||||||||||||||
|---|---|---|---|---|---|---|---|---|---|---|---|---|---|---|---|---|---|---|---|---|---|---|---|---|---|---|---|---|---|---|---|---|---|---|---|---|---|
| |||||||||||||||||||||||||||||||||||||
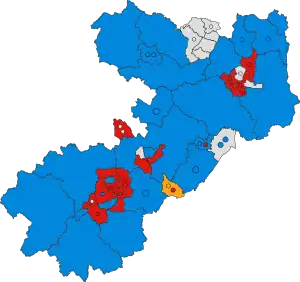 Winner of each seat at the 2023 Cheshire East Council election | |||||||||||||||||||||||||||||||||||||
| |||||||||||||||||||||||||||||||||||||
Summary
Election result
| 2023 Cheshire East Council election | ||||||||||
|---|---|---|---|---|---|---|---|---|---|---|
| Party | Candidates | Seats | Gains | Losses | Net gain/loss | Seats % | Votes % | Votes | +/− | |
| Conservative | 81 | 33 | 4 | 5 | -1 | 40 | 36.70 | 64,154 | +3,315 | |
| Labour | 60 | 31 | 10 | 4 | +6 | 38 | 30.15 | 52,712 | ||
| Independent | 25 | 10 | 4 | 5 | -1 | 19,338 | ||||
| Residents of Wilmslow | 5 | 5 | 1 | +1 | 5,143 | |||||
| Liberal Democrats | 31 | 2 | 2 | -2 | 13,983 | |||||
| Alderley Edge First | 1 | 1 | 1,095 | |||||||
| Green | 33 | 0 | 12,148 | |||||||
| Putting Crewe First | 10 | 0 | 3,580 | |||||||
| Bollington First | 2 | 0 | 2 | -2 | 1,195 | |||||
| Women's Equality | 1 | 0 | 1,132 | |||||||
| Reform UK | 2 | 0 | 114 | |||||||
| SDP | 1 | 0 | 157 | |||||||
| Monster Raving Loony | 1 | 0 | 57 | |||||||
| Handforth Ratepayers Association | 0 | 0 | 1 | -1 | 0 | |||||
Results by ward
Alderley Edge
| Party | Candidate | Votes | % | ||
|---|---|---|---|---|---|
| Alderley Edge First | Craig Browne | 1,095 | 79.00 | ||
| Conservative | Carl Curran | 195 | 14.07 | ||
| Green | Katerine Boxer | 96 | 6.93 | ||
| Turnout | |||||
| Alderley Edge First hold | |||||
Alsager
| Party | Candidate | Votes | % | ||
|---|---|---|---|---|---|
| Liberal Democrats | Rod Fletcher | 1,653 | 18.97 | ||
| Labour | Brian Drake | 1,326 | 15.22 | ||
| Liberal Democrats | Reg Kain | 1,281 | 14.70 | ||
| Labour | Michael Unett | 1,210 | 13.88 | ||
| Conservative | Wendy Whittaker-Large | 1,068 | 12.25 | ||
| Conservative | Sam Worthington | 845 | 9.70 | ||
| Green | Hilary Robinson | 679 | 7.79 | ||
| Green | Richard McCarthy | 653 | 7.49 | ||
| Turnout | |||||
| Liberal Democrats hold | |||||
| Labour gain from Liberal Democrats | |||||
| Liberal Democrats hold | |||||
Audlem
| Party | Candidate | Votes | % | ||
|---|---|---|---|---|---|
| Conservative | Rachel Anne Bailey | 1,023 | 64.22 | ||
| Liberal Democrats | John Phillips | 570 | 35.78 | ||
| Turnout | |||||
| Conservative hold | |||||
Bollington
| Party | Candidate | Votes | % | ||
|---|---|---|---|---|---|
| Labour | Ken Edwards | 992 | 19.10 | ||
| Labour | John Place | 730 | 14.06 | ||
| Conservative | Jon Weston | 714 | 13.75 | ||
| Bollington First | Amanda Stott | 646 | 12.44 | ||
| Liberal Democrats | Johanna Maitland | 562 | 10.82 | ||
| Bollington First | James William David Nicholas | 549 | 10.57 | ||
| Conservative | John Withers | 535 | 10.30 | ||
| Green | Jennifer Allen | 302 | 5.82 | ||
| Green | Liam Bergin | 163 | 3.14 | ||
| Turnout | |||||
| Labour gain from Bollington First | |||||
| Labour gain from Bollington First | |||||
Brereton Rural
| Party | Candidate | Votes | % | ||
|---|---|---|---|---|---|
| Conservative | John Wray | 841 | 42.11 | ||
| Liberal Democrats | Robert Douglas | 627 | 31.40 | ||
| Labour | Mark Mitchell | 529 | 26.49 | ||
| Turnout | |||||
| Conservative hold | |||||
Broken Cross and Upton
| Party | Candidate | Votes | % | ||
|---|---|---|---|---|---|
| Labour | Judy Snowball | 1,301 | 30.28 | ||
| Labour | Rob Vernon | 1,248 | 29.04 | ||
| Conservative | Gareth Jones | 894 | 20.81 | ||
| Conservative | Uche John | 854 | 19.87 | ||
| Turnout | |||||
| Labour hold | |||||
| Labour hold | |||||
Bunbury
| Party | Candidate | Votes | % | ||
|---|---|---|---|---|---|
| Conservative | Rebecca Posnett | 912 | 51.88 | ||
| Liberal Democrats | Jonathan Bill | 846 | 48.12 | ||
| Turnout | |||||
| Conservative hold | |||||
Chelford
| Party | Candidate | Votes | % | ||
|---|---|---|---|---|---|
| Conservative | Anthony Harrison | 913 | 65.97 | ||
| Liberal Democrats | Nicola Standitch | 275 | 19.87 | ||
| Green | Nick Speakman | 196 | 14.16 | ||
| Turnout | |||||
| Conservative hold | |||||
Congleton East
| Party | Candidate | Votes | % | ||
|---|---|---|---|---|---|
| Independent | Rob Moreton | 1,322 | 13.45 | ||
| Conservative | Sally Holland | 1,297 | 13.20 | ||
| Conservative | David Brown | 1,151 | 11.71 | ||
| Women's Equality | Kay Wesley | 1,132 | 11.52 | ||
| Conservative | Glen Williams | 955 | 9.72 | ||
| Labour | Sarah Russell | 895 | 9.11 | ||
| Independent | Heather Pearce | 813 | 8.27 | ||
| Green | Lisa Miller | 760 | 7.73 | ||
| Liberal Democrats | Denis Murphy | 605 | 6.16 | ||
| Liberal Democrats | Michael Duffy | 451 | 4.59 | ||
| Independent | Martin Amies | 448 | 4.56 | ||
| Turnout | |||||
| Independent hold | |||||
| Conservative gain from Liberal Democrats | |||||
| Conservative hold | |||||
Congleton West
| Party | Candidate | Votes | % | ||
|---|---|---|---|---|---|
| Conservative | Emma Hall | 1,207 | 12.33 | ||
| Conservative | George Hayes | 1,183 | 12.08 | ||
| Labour | Heather Seddon | 1,179 | 12.04 | ||
| Conservative | Amanda Martin | 1,080 | 11.03 | ||
| Liberal Democrats | Suzy Firkin | 1,069 | 10.92 | ||
| Independent | Suzie Akers Smith | 1,066 | 10.89 | ||
| Independent | Mark Edwardson | 1,005 | 10.27 | ||
| Liberal Democrats | Robert Hemsley | 764 | 7.80 | ||
| Green | Olga Whitmore | 671 | 6.85 | ||
| Independent | Mark Hill | 565 | 5.77 | ||
| Turnout | |||||
| Conservative hold | |||||
| Conservative hold | |||||
| Labour gain from Independent | |||||
Crewe Central
| Party | Candidate | Votes | % | ||
|---|---|---|---|---|---|
| Labour | Anthony Critchley | 448 | 54,70 | ||
| Conservative | Christopher Waling | 192 | 23.44 | ||
| Putting Crewe First | Ireneusz Kryczka | 126 | 15.38 | ||
| Reform UK | Matthew Wood | 53 | 6.47 | ||
| Turnout | |||||
| Labour hold | |||||
Crewe East
| Party | Candidate | Votes | % | ||
|---|---|---|---|---|---|
| Labour | Hazel Faddes | 1,329 | 17.91 | ||
| Labour | Martin Edwards | 1,199 | 16.15 | ||
| Labour | Jill Rhodes | 1,168 | 15.74 | ||
| Putting Crewe First | Richard Ford | 646 | 8.70 | ||
| Putting Crewe First | Jackie Barthelmes | 601 | 8.10 | ||
| Putting Crewe First | Helen Elliott | 590 | 7.95 | ||
| Conservative | Jonathan Bebbington | 442 | 5.96 | ||
| Conservative | Carol Groves | 408 | 5.50 | ||
| Conservative | Peter Hargreaves | 386 | 5.20 | ||
| Green | Melanie English | 314 | 4.23 | ||
| Green | Ian Mumford | 223 | 3.00 | ||
| Green | Gareth Woods | 166 | 1.56 | ||
| Turnout | |||||
| Labour hold | |||||
| Labour hold | |||||
| Labour hold | |||||
Crewe North
| Party | Candidate | Votes | % | ||
|---|---|---|---|---|---|
| Labour | Joy Bratherton | 483 | 51.77 | ||
| Putting Crewe First | Brian Silvester | 334 | 35.80 | ||
| Conservative | Daniel Hill | 116 | 12.43 | ||
| Turnout | |||||
| Labour hold | |||||
Crewe South
| Party | Candidate | Votes | % | ||
|---|---|---|---|---|---|
| Labour | Laura Smith | 1,026 | 31.41 | ||
| Labour | Dawn Clark | 1,011 | 30.96 | ||
| Conservative | Ryan Moore | 353 | 10.81 | ||
| Putting Crewe First | Tom Maguire | 314 | 9.61 | ||
| Conservative | Adam Boulton-Rawlinson | 299 | 9.15 | ||
| Putting Crewe First | Tony Mortimer | 263 | 8.05 | ||
| Turnout | |||||
| Labour hold | |||||
| Labour hold | |||||
Crewe St. Barnabas
| Party | Candidate | Votes | % | ||
|---|---|---|---|---|---|
| Conservative | James Pratt | 348 | 49.50 | ||
| Labour | Sally Handley | 266 | 37.84 | ||
| Putting Crewe First | Tony Mortimer | 89 | 12.66 | ||
| Turnout | |||||
| Conservative gain from Labour | |||||
Crewe West
| Party | Candidate | Votes | % | ||
|---|---|---|---|---|---|
| Labour | Marilyn Houston | 965 | 31.67 | ||
| Labour | Connor Naismith | 911 | 29.90 | ||
| Putting Crewe First | Stephen Macallan | 318 | 10.44 | ||
| Putting Crewe First | Craig Porter | 299 | 9.81 | ||
| Conservative | Daniel Bull | 277 | 9.09 | ||
| Conservative | Jacquie Weatherill | 277 | 9.09 | ||
| Turnout | |||||
| Labour hold | |||||
| Labour hold | |||||
Dane Valley
| Party | Candidate | Votes | % | ||
|---|---|---|---|---|---|
| Conservative | Andrew Kolker | 1,616 | 28.19 | ||
| Conservative | Russell Chadwick | 1,394 | 24.32 | ||
| Liberal Democrats | Diane Tams | 1,065 | 18.58 | ||
| Labour | Craig Hynes | 756 | 13.19 | ||
| Green | Martin Wood | 631 | 11.01 | ||
| Green | Robert Green | 271 | 4.73 | ||
| Turnout | |||||
| Conservative hold | |||||
| Conservative hold | |||||
Disley
| Party | Candidate | Votes | % | ||
|---|---|---|---|---|---|
| Conservative | Sue Adams | 868 | 56.65 | ||
| Labour | Nell Carter | 533 | 34.08 | ||
| Independent | Paul Moss | 145 | 9.27 | ||
| Turnout | |||||
| Conservative gain from Independent | |||||
Gawsworth
| Party | Candidate | Votes | % | ||
|---|---|---|---|---|---|
| Conservative | Lesley Smetham | 843 | 63.34 | ||
| Labour | Sam Hale | 204 | 15.33 | ||
| Liberal Democrats | Eleanor Hall | 180 | 13.52 | ||
| Green | Andrew Wheatstone | 104 | 7.81 | ||
| Turnout | |||||
| Conservative hold | |||||
Handforth
| Party | Candidate | Votes | % | ||
|---|---|---|---|---|---|
| Independent | Julie Smith | 1,474 | 34.14 | ||
| Independent | John Smith | 1,300 | 30.11 | ||
| Labour | Ribia Nisa | 668 | 15.47 | ||
| Conservative | Simon Hutchence | 312 | 7.23 | ||
| Conservative | Matthew Robertson | 291 | 6.74 | ||
| Liberal Democrats | James Earl | 273 | 6.32 | ||
| Turnout | |||||
| Independent hold | |||||
| Independent gain from Handforth Ratepayers' Association | |||||
Haslington
| Party | Candidate | Votes | % | ||
|---|---|---|---|---|---|
| Conservative | Steven Edgar | 1,240 | 26.17 | ||
| Conservative | Alison Heler | 1,149 | 24.25 | ||
| Labour | Simon Richards | 1,027 | 21.68 | ||
| Labour | Jamie Messent | 943 | 19.90 | ||
| Green | Te Ata Browne | 379 | 8.00 | ||
| Turnout | |||||
| Conservative hold | |||||
| Conservative hold | |||||
High Legh
| Party | Candidate | Votes | % | ||
|---|---|---|---|---|---|
| Conservative | Kate Parkinson | 865 | 63.00 | ||
| Liberal Democrats | Christopher Fortune | 451 | 32.85 | ||
| Monster Raving Loony | Andy Sheik El Wright'O | 57 | 4.15 | ||
| Turnout | |||||
| Conservative hold | |||||
Knutsford
| Party | Candidate | Votes | % | ||
|---|---|---|---|---|---|
| Conservative | Stewart Gardiner | 1,716 | 16.72 | ||
| Conservative | Tony Dean | 1,672 | 16.20 | ||
| Conservative | Peter Coan | 1,662 | 16.10 | ||
| Labour | Sue Addison | 1,348 | 13.06 | ||
| Green | Amanda Iremonger | 1,090 | 10.56 | ||
| Labour | Kevin Harkin | 963 | 9.33 | ||
| Independent | April Johnson | 708 | 6.86 | ||
| Liberal Democrats | Adrian Cardwell | 645 | 6.25 | ||
| Independent | Rex Mears | 519 | 5.03 | ||
| Turnout | |||||
| Conservative hold | |||||
| Conservative hold | |||||
| Conservative gain from Independent | |||||
Leighton
| Party | Candidate | Votes | % | ||
|---|---|---|---|---|---|
| Labour | Clair Chapman | 456 | 36.69 | ||
| Independent | Jim Weir | 412 | 33.15 | ||
| Conservative | Teja Vaddala | 375 | 30.17 | ||
| Turnout | 31.48 | ||||
| Labour gain from Independent | |||||
Macclesfield Central
| Party | Candidate | Votes | % | ||
|---|---|---|---|---|---|
| Labour | Liz Braithwaite | 1,368 | 34.62 | ||
| Labour | Ashley Farrall | 1,102 | 27.88 | ||
| Green | John Knight | 558 | 14.12 | ||
| Conservative | Abhishika Srivastav | 345 | 8.73 | ||
| Conservative | Jessica Beaumont | 328 | 8.30 | ||
| Liberal Democrats | Stephen Broadhead | 251 | 6.35 | ||
| Turnout | |||||
| Labour hold | |||||
| Labour hold | |||||
Macclesfield East
| Party | Candidate | Votes | % | ||
|---|---|---|---|---|---|
| Independent | Mick Warren | 789 | 58.88 | ||
| Labour | Terry Bell | 292 | 21.79 | ||
| Conservative | Nicholas Taylor | 120 | 8.96 | ||
| Green | Lindy Brett | 111 | 8.28 | ||
| Liberal Democrats | Christopher Lovell | 28 | 2.09 | ||
| Turnout | |||||
| Independent hold | |||||
Macclesfield Hurdsfield
| Party | Candidate | Votes | % | ||
|---|---|---|---|---|---|
| Labour | Sarah Bennett-Wake | 640 | 69.19 | ||
| Liberal Democrats | Steve Broadhurst | 173 | 18.70 | ||
| Conservative | Barrie Malpas | 112 | 12.11 | ||
| Turnout | |||||
| Labour hold | |||||
Macclesfield South
| Party | Candidate | Votes | % | ||
|---|---|---|---|---|---|
| Labour | Fiona Wilson | 916 | 26.64 | ||
| Labour | Brian Puddicombe | 868 | 25.24 | ||
| Independent | Andy Oldfield | 504 | 14.66 | ||
| Conservative | David Dooley | 308 | 8.96 | ||
| Conservative | Joyce Beasley | 293 | 8.52 | ||
| Independent | Eddie Murphy | 292 | 8.49 | ||
| Green | John Peckham | 258 | 7.50 | ||
| Turnout | |||||
| Labour hold | |||||
| Labour hold | |||||
Macclesfield Tytherington
| Party | Candidate | Votes | % | ||
|---|---|---|---|---|---|
| Independent | David Edwardes | 1,472 | 27.43 | ||
| Independent | Louise Gilman | 1,117 | 20.81 | ||
| Conservative | Beverley Dooley | 878 | 16.36 | ||
| Conservative | John Le Moignan | 755 | 14.07 | ||
| Labour | John Bowden | 606 | 11.29 | ||
| Green | David Mayers | 347 | 6.47 | ||
| Green | Walter Houston | 192 | 3.58 | ||
| Turnout | |||||
| Independent hold | |||||
| Independent hold | |||||
Macclesfield West and Ivy
| Party | Candidate | Votes | % | ||
|---|---|---|---|---|---|
| Labour | Nicholas Peter Mannion | 1,176 | 32.87 | ||
| Labour | Mary Brooks | 1,061 | 29.65 | ||
| Conservative | Timothy Swatridge | 559 | 15.62 | ||
| Conservative | Rajeev Rajan | 511 | 14.28 | ||
| Turnout | |||||
| Labour hold | |||||
| Labour hold | |||||
Middlewich
| Party | Candidate | Votes | % | ||
|---|---|---|---|---|---|
| Labour | Carol Bulman | 1,088 | 13.28 | ||
| Independent | Marshall Garnet | 1,084 | 13.23 | ||
| Independent | John Bird | 1,078 | 13.15 | ||
| Labour | Michael Hunter | 1,036 | 12.64 | ||
| Labour | Jonathan Parry | 1,030 | 12.57 | ||
| Conservative | Paul Edwards | 811 | 9.90 | ||
| Conservative | David Harrop | 782 | 9.54 | ||
| Green | Cerys Jones | 667 | 8.14 | ||
| Conservative | Robert Brittain | 619 | 7.55 | ||
| Turnout | |||||
| Labour hold | |||||
| Independent gain from Labour | |||||
| Independent gain from Labour | |||||
Mobberley
| Party | Candidate | Votes | % | ||
|---|---|---|---|---|---|
| Conservative | Hannah Moss | 884 | 73.00 | ||
| Labour | Paul Thomson | 205 | 16.93 | ||
| Liberal Democrats | Kevin Boyle | 122 | 10.07 | ||
| Turnout | |||||
| Conservative hold | |||||
Nantwich North and West
| Party | Candidate | Votes | % | ||
|---|---|---|---|---|---|
| Labour | Anna Burton | 1,109 | 25.61 | ||
| Independent | Arthur Moran | 768 | 17.74 | ||
| Conservative | Vicky Higham | 724 | 16.72 | ||
| Conservative | John Statham | 637 | 14.71 | ||
| Independent | Stuart Bostock | 593 | 13.70 | ||
| Green | Kim Hayes | 317 | 7.32 | ||
| Green | Tom Levins | 182 | 4.20 | ||
| Turnout | |||||
| Labour gain from Independent | |||||
| Independent hold | |||||
Nantwich South and Stapeley
| Party | Candidate | Votes | % | ||
|---|---|---|---|---|---|
| Labour | Geoffrey Smith | 1,483 | 26.15 | ||
| Labour | John Priest | 1,478 | 26.06 | ||
| Conservative | Andrew Martin | 1,395 | 24.59 | ||
| Conservative | Peter Groves | 1,316 | 23.20 | ||
| Turnout | |||||
| Labour gain from Conservative | |||||
| Labour gain from Conservative | |||||
Odd Rode
| Party | Candidate | Votes | % | ||
|---|---|---|---|---|---|
| Conservative | Patrick Redstone | 1,152 | 28.31 | ||
| Conservative | Liz Wardlaw | 1,131 | 27.80 | ||
| Labour | Ursula Griffiths | 900 | 22.12 | ||
| Labour | Gareth Lindop | 886 | 21.77 | ||
| Turnout | |||||
| Conservative hold | |||||
| Conservative hold | |||||
Poynton East and Pott Shrigley
| Party | Candidate | Votes | % | ||
|---|---|---|---|---|---|
| Conservative | Jos Saunders | 1,310 | 27.09 | ||
| Conservative | Hayley Whitaker | 1,256 | 25.98 | ||
| Labour | Sarah Marshall | 810 | 16.75 | ||
| Labour | Geoff Thompson | 797 | 16.48 | ||
| Green | James Booth | 505 | 10.44 | ||
| SDP | Tim O'Rourke | 157 | 3.25 | ||
| Turnout | |||||
| Conservative hold | |||||
| Conservative hold | |||||
Poynton West and Adlington
| Party | Candidate | Votes | % | ||
|---|---|---|---|---|---|
| Conservative | Michael Beanland | 1,432 | 27.67 | ||
| Conservative | Mike Sewart | 1,421 | 27.46 | ||
| Labour | Tony Penny | 898 | 17.35 | ||
| Labour | Amy House | 829 | 16.02 | ||
| Green | Kathy Booth | 595 | 11.50 | ||
| Turnout | 39.67 | ||||
| Conservative hold | |||||
| Conservative hold | |||||
Prestbury
| Party | Candidate | Votes | % | ||
|---|---|---|---|---|---|
| Conservative | Thelma Jackson | 980 | 74.36 | ||
| Independent | Stuart Redgard | 338 | 25.64 | ||
| Turnout | |||||
| Conservative hold | |||||
Sandbach Elworth
| Party | Candidate | Votes | % | ||
|---|---|---|---|---|---|
| Independent | Nicola Cook | 718 | 43.05 | ||
| Labour | Kathryn Flavell | 616 | 36.93 | ||
| Conservative | Arabella Holland | 253 | 15.17 | ||
| Liberal Democrats | Callum Chalmers | 81 | 4.86 | ||
| Turnout | |||||
| Independent gain from Labour | |||||
Sandbach Ettiley Heath and Wheelock
| Party | Candidate | Votes | % | ||
|---|---|---|---|---|---|
| Labour | Laura Crane | 715 | 53.76 | ||
| Conservative | Martin Deakin | 445 | 33.46 | ||
| Green | Patricia Lloyd | 99 | 7.44 | ||
| Liberal Democrats | Michelle Hough | 71 | 5.34 | ||
| Turnout | |||||
| Labour hold | |||||
Sandbach Heath and East
| Party | Candidate | Votes | % | ||
|---|---|---|---|---|---|
| Labour | Sam Corcoran | 563 | 40.83 | ||
| Conservative | Tim Wheatcroft | 423 | 30.67 | ||
| Independent | Dave Poole | 322 | 23.35 | ||
| Green | Peter Kent | 71 | 5.15 | ||
| Turnout | |||||
| Labour hold | |||||
Sandbach Town
| Party | Candidate | Votes | % | ||
|---|---|---|---|---|---|
| Conservative | Mike Muldoon | 688 | 45.59 | ||
| Labour | John Arnold | 598 | 39.63 | ||
| Liberal Democrats | Artie Chalmers | 141 | 9.34 | ||
| Green | Hope Voyce | 82 | 5.43 | ||
| Turnout | |||||
| Conservative hold | |||||
Shavington
| Party | Candidate | Votes | % | ||
|---|---|---|---|---|---|
| Labour | Linda Buchanan | 573 | 40.81 | ||
| Independent | David Marren | 486 | 34.62 | ||
| Conservative | Claire Wain | 345 | 24.27 | ||
| Turnout | |||||
| Labour gain from Conservative | |||||
Sutton
| Party | Candidate | Votes | % | ||
|---|---|---|---|---|---|
| Conservative | Chris O'Leary | 678 | 45.47 | ||
| Liberal Democrats | Trevor Priestman | 311 | 20.86 | ||
| Labour | Steve Kay | 276 | 18.51 | ||
| Green | Laura Jones | 226 | 15.16 | ||
| Turnout | |||||
| Conservative hold | |||||
Willaston and Rope
| Party | Candidate | Votes | % | ||
|---|---|---|---|---|---|
| Conservative | Allen Gage | 957 | 54.13 | ||
| Labour | Ben Wye | 630 | 35.63 | ||
| Green | Richard Bennett | 120 | 6.79 | ||
| Reform UK | Julie Fousert | 61 | 3.45 | ||
| Turnout | |||||
| Conservative hold | |||||
Wilmslow Dean Row
| Party | Candidate | Votes | % | ||
|---|---|---|---|---|---|
| Residents of Wilmslow | Lata Anderson | 703 | 53.42 | ||
| Conservative | Jack Illingworth | 481 | 36.55 | ||
| Liberal Democrats | Olivia Walker | 132 | 10.03 | ||
| Turnout | |||||
| Residents of Wilmslow hold | |||||
Wilmslow East
| Party | Candidate | Votes | % | ||
|---|---|---|---|---|---|
| Residents of Wilmslow | David Jefferay | 832 | 64.00 | ||
| Conservative | John Duckworth | 383 | 29.46 | ||
| Liberal Democrats | Sarah Murphy | 85 | 6.54 | ||
| Turnout | |||||
| Residents of Wilmslow hold | |||||
Wilmslow Lacey Green
| Party | Candidate | Votes | % | ||
|---|---|---|---|---|---|
| Residents of Wilmslow | Chris Hilliard | 591 | 47.55 | ||
| Conservative | Don Stockton | 475 | 38.21 | ||
| Liberal Democrats | James Robin | 177 | 14.24 | ||
| Turnout | |||||
| Residents of Wilmslow gain from Conservative | |||||
Wilmslow West and Chorley
| Party | Candidate | Votes | % | ||
|---|---|---|---|---|---|
| Residents of Wilmslow | Mark Goldsmith | 1,560 | 27.44 | ||
| Residents of Wilmslow | Michael Gorman | 1,457 | 25.62 | ||
| Conservative | Barry Estill | 977 | 17.18 | ||
| Conservative | Hannan Sarwar | 787 | 13.84 | ||
| Green | Michelle Anderson | 539 | 9.48 | ||
| Liberal Democrats | Gareth Wilson | 366 | 6.44 | ||
| Turnout | |||||
| Residents of Wilmslow hold | |||||
| Residents of Wilmslow hold | |||||
Wistaston
| Party | Candidate | Votes | % | ||
|---|---|---|---|---|---|
| Labour | Alan Coiley | 1,418 | 25.81 | ||
| Conservative | Margaret Joan Simon | 1,321 | 24.04 | ||
| Labour | Kim Jamson | 1,295 | 23.57 | ||
| Conservative | Gary Poole | 1,120 | 20.39 | ||
| Green | Claire Wilkinson | 340 | 6.19 | ||
| Turnout | |||||
| Labour gain from Conservative | |||||
| Conservative hold | |||||
Wrenbury
| Party | Candidate | Votes | % | ||
|---|---|---|---|---|---|
| Conservative | James Pearson | 806 | 49.69 | ||
| Liberal Democrats | Sacha Sandbach | 575 | 35.45 | ||
| Green | Dave Manning | 241 | 14.86 | ||
| Turnout | |||||
| Conservative hold | |||||
Wybunbury
| Party | Candidate | Votes | % | ||
|---|---|---|---|---|---|
| Conservative | Janet Christine Clowes | 1,170 | 70.52 | ||
| Labour | Dennis Straine-Francis | 336 | 20.25 | ||
| Liberal Democrats | Stephen Ford | 153 | 9.22 | ||
| Turnout | |||||
| Conservative hold | |||||
Notes
- Italics denote a sitting councillor for the same ward.
References
- "2023 Cheshire East Borough Election Results - All results by Ward". cheshireeast.gov.uk.
| Cheshire East Council | |
|---|---|
| Cheshire West and Chester Council | |
| Halton Borough Council | |
| Warrington Borough Council | |
| Cheshire County Council |
|
| Chester City Council |
|
| Congleton Borough Council |
|
| Crewe and Nantwich Borough Council |
|
| Ellesmere Port and Neston Borough Council | |
| Macclesfield Borough Council | |
| Vale Royal Borough Council |
|
See also: Wards, Boundary changes | |
This article is issued from Wikipedia. The text is licensed under Creative Commons - Attribution - Sharealike. Additional terms may apply for the media files.