2023 Lewes District Council election
The 2023 Lewes District Council election took place on 4 May 2023 to elect members of Lewes District Council in East Sussex, England.[1] This was on the same day as other local elections in England.
| |||||||||||||||||||||||||||||||||||||||||||||||||||||||||||||||||
All 41 seats to Lewes District Council 21 seats needed for a majority | |||||||||||||||||||||||||||||||||||||||||||||||||||||||||||||||||
|---|---|---|---|---|---|---|---|---|---|---|---|---|---|---|---|---|---|---|---|---|---|---|---|---|---|---|---|---|---|---|---|---|---|---|---|---|---|---|---|---|---|---|---|---|---|---|---|---|---|---|---|---|---|---|---|---|---|---|---|---|---|---|---|---|---|
| |||||||||||||||||||||||||||||||||||||||||||||||||||||||||||||||||
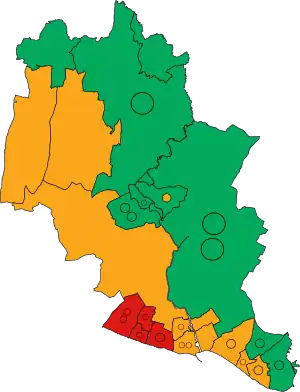 Winner of each seat at the 2023 Lewes District Council election | |||||||||||||||||||||||||||||||||||||||||||||||||||||||||||||||||
| |||||||||||||||||||||||||||||||||||||||||||||||||||||||||||||||||
Prior to the election the council was under no overall control, being run by a "co-operative alliance" comprising the Liberal Democrat, Green and Labour groups and one independent councillor.[2]
Summary
Election result
| 2023 Lewes District Council election | ||||||||||
|---|---|---|---|---|---|---|---|---|---|---|
| Party | Candidates | Seats | Gains | Losses | Net gain/loss | Seats % | Votes % | Votes | +/− | |
| Green | 41 | 17 | 9 | 1 | 41.5 | 31.8 | 19,991 | +3.9 | ||
| Liberal Democrats | 41 | 15 | 7 | 0 | 36.6 | 28.0 | 17,610 | +5.5 | ||
| Labour | 20 | 9 | 6 | 0 | 22.0 | 16.7 | 10,522 | +6.2 | ||
| Conservative | 35 | 0 | 0 | 19 | 0.0 | 22.1 | 13,893 | –5.0 | ||
| Independent | 5 | 0 | 0 | 2 | 0.0 | 1.2 | 776 | –8.9 | ||
| Reform UK | 1 | 0 | 0 | 0 | 0.0 | 0.2 | 129 | N/A | ||
Ward results
The Statement of Persons Nominated, which details the candidates standing in each ward, was released by Lewes District Council following the close of nominations on 5 April 2023.[3]
Chailey, Barcombe & Hamsey
| Party | Candidate | Votes | % | ±% | |
|---|---|---|---|---|---|
| Green | Joa Saunders | 990 | 53.7 | +30.7 | |
| Green | Mark Slater | 914 | 49.6 | +27.7 | |
| Conservative | Sharon Davy* | 686 | 37.2 | –8.0 | |
| Conservative | Isabelle Linington* | 640 | 34.7 | –6.2 | |
| Liberal Democrats | Marlon Hughes | 247 | 13.4 | –11.5 | |
| Liberal Democrats | Peter Spain | 212 | 11.5 | –10.3 | |
| Turnout | |||||
| Green gain from Conservative | |||||
| Green gain from Conservative | |||||
Ditchling & Westmeston
| Party | Candidate | Votes | % | ±% | |
|---|---|---|---|---|---|
| Liberal Democrats | Paul Mellor | 377 | 34.3 | –5.8 | |
| Green | Edward Elford | 365 | 33.2 | +20.8 | |
| Conservative | Alan Jones | 356 | 32.4 | –15.3 | |
| Majority | 12 | 1.1 | N/A | ||
| Turnout | |||||
| Liberal Democrats gain from Conservative | Swing | ||||
East Saltdean & Telscombe Cliffs
| Party | Candidate | Votes | % | ±% | |
|---|---|---|---|---|---|
| Labour | Christine Robinson* | 1,132 | 69.9 | +32.5 | |
| Labour | Laurence O'Connor* | 1,089 | 67.3 | +33.0 | |
| Labour | Ian Alexander | 1,087 | 67.2 | N/A | |
| Conservative | Paul Clark | 538 | 33.2 | –2.3 | |
| Liberal Democrats | Simon Ackroyd | 328 | 20.3 | +5.3 | |
| Liberal Democrats | Liz Lee | 180 | 11.1 | N/A | |
| Green | Nicky Blackwell | 151 | 9.3 | –20.2 | |
| Liberal Democrats | Donna Martinez-Claras | 132 | 8.2 | N/A | |
| Green | Nick Tigg | 112 | 6.9 | N/A | |
| Green | Diana Wilkins | 106 | 6.5 | N/A | |
| Turnout | |||||
| Labour hold | |||||
| Labour hold | |||||
| Labour gain from Conservative | |||||
Kingston
| Party | Candidate | Votes | % | ±% | |
|---|---|---|---|---|---|
| Liberal Democrats | Stella Spiteri | 431 | 47.5 | –4.3 | |
| Green | David Hoare | 326 | 35.9 | +18.1 | |
| Conservative | Rosemarie Jeffery | 150 | 16.5 | –6.8 | |
| Majority | 105 | 11.6 | –16.8 | ||
| Turnout | |||||
| Liberal Democrats hold | Swing | ||||
Lewes Bridge
| Party | Candidate | Votes | % | ±% | |
|---|---|---|---|---|---|
| Green | Zoe Nicholson* | 916 | 49.3 | –0.7 | |
| Liberal Democrats | Janet Baah | 812 | 43.7 | +4.2 | |
| Green | Adrian Ross* | 794 | 42.7 | –0.9 | |
| Liberal Democrats | Jeremy Halley | 491 | 26.4 | –6.4 | |
| Labour | Matt Kent | 246 | 13.2 | +1.6 | |
| Conservative | Colin French | 168 | 9.0 | +0.1 | |
| Labour | Amy Wilkins | 147 | 7.9 | –1.5 | |
| Conservative | Catharine Robinson | 144 | 7.7 | –0.5 | |
| Turnout | |||||
| Green hold | |||||
| Liberal Democrats gain from Green | |||||
Lewes Castle
| Party | Candidate | Votes | % | ±% | |
|---|---|---|---|---|---|
| Green | Wendy Maples | 696 | 47.8 | +5.4 | |
| Green | Nicolas Kortalla-Bird | 600 | 41.2 | +3.5 | |
| Labour | Emily Clarke | 572 | 39.3 | +14.4 | |
| Labour | Stephen Catlin | 356 | 24.5 | +11.4 | |
| Liberal Democrats | Kate Wood | 236 | 16.2 | –16.3 | |
| Liberal Democrats | Tony Parker | 229 | 15.7 | –13.7 | |
| Conservative | Diane Burman | 122 | 8.4 | +2.2 | |
| Conservative | Karen French | 99 | 6.8 | +0.7 | |
| Turnout | |||||
| Green hold | |||||
| Green hold | |||||
Lewes Priory
| Party | Candidate | Votes | % | ±% | |
|---|---|---|---|---|---|
| Green | Imogen Makepeace* | 1,727 | 54.7 | +13.4 | |
| Green | Graham Clews | 1,457 | 46.2 | +8.6 | |
| Green | Paul Keene | 1,420 | 45.0 | +14.0 | |
| Liberal Democrats | Kevin West | 981 | 31.1 | +14.0 | |
| Liberal Democrats | Paddy Henshaw | 927 | 29.4 | +15.0 | |
| Liberal Democrats | Edwina Livesey | 870 | 27.6 | +15.6 | |
| Labour | Linda Drabble | 550 | 17.4 | +10.9 | |
| Labour | Peter Hambly | 515 | 16.3 | +9.9 | |
| Labour | Danny Sweeney | 423 | 13.4 | +7.3 | |
| Conservative | Catherine Boorman | 318 | 10.1 | +6.1 | |
| Conservative | Elizabeth Slater | 283 | 9.0 | +5.3 | |
| Turnout | |||||
| Green hold | |||||
| Green gain from Independent | |||||
| Green hold | |||||
Newhaven North
| Party | Candidate | Votes | % | ±% | |
|---|---|---|---|---|---|
| Liberal Democrats | Julie Carr* | 628 | 58.7 | +31.1 | |
| Liberal Democrats | Sean Macleod | 589 | 55.0 | +30.1 | |
| Independent | Steve Saunders* | 348 | 32.5 | –2.4 | |
| Conservative | Susan Chowen | 245 | 22.9 | –1.0 | |
| Independent | Andrew Winter | 171 | 15.2 | N/A | |
| Green | Tai Ray-Jones | 96 | 9.0 | –1.5 | |
| Green | Dirk Campbell | 64 | 6.0 | –3.8 | |
| Turnout | |||||
| Liberal Democrats hold | |||||
| Liberal Democrats gain from Independent | |||||
Newhaven South
| Party | Candidate | Votes | % | ±% | |
|---|---|---|---|---|---|
| Liberal Democrats | Graham Amy* | 766 | 58.3 | +4.2 | |
| Liberal Democrats | James MacCleary* | 672 | 51.2 | +7.3 | |
| Liberal Democrats | Christoph Von Kurthy* | 611 | 46.5 | +1.2 | |
| Independent | Pinky McLean-Knight | 387 | 29.5 | N/A | |
| Conservative | Bill Giles | 338 | 25.7 | +6.9 | |
| Conservative | Linda Wallraven | 263 | 20.0 | +4.5 | |
| Conservative | Abdul Ahmed | 239 | 18.2 | +2.9 | |
| Green | Holly Atkins | 216 | 16.5 | –2.0 | |
| Independent | Nick Jones | 189 | 14.4 | N/A | |
| Green | Martin Meadows | 140 | 10.7 | –7.4 | |
| Green | Martin O'Brien | 118 | 9.0 | –6.1 | |
| Turnout | |||||
| Liberal Democrats hold | |||||
| Liberal Democrats hold | |||||
| Liberal Democrats hold | |||||
Newick
| Party | Candidate | Votes | % | ±% | |
|---|---|---|---|---|---|
| Green | Charlotte Keenan | 533 | 56.5 | +39.1 | |
| Conservative | Nate Delo | 337 | 35.7 | –21.3 | |
| Liberal Democrats | Samantha Robbins | 73 | 7.7 | –12.4 | |
| Majority | 194 | 25.8 | N/A | ||
| Turnout | |||||
| Green gain from Conservative | Swing | ||||
Ouse Valley & Ringmer
| Party | Candidate | Votes | % | ±% | |
|---|---|---|---|---|---|
| Green | Johnny Denis* | 1,263 | 57.1 | –6.2 | |
| Green | Emily O'Brien* | 1,213 | 54.8 | +5.1 | |
| Green | Lucy Agace | 1,042 | 47.1 | +2.3 | |
| Conservative | Richard Turner | 697 | 31.5 | +8.8 | |
| Conservative | Matther Crisp | 659 | 29.8 | +7.1 | |
| Conservative | Katie Sanderson | 595 | 26.9 | +5.1 | |
| Liberal Democrats | Victoria Vincent | 420 | 19.0 | –7.2 | |
| Liberal Democrats | Cathy Bryan | 383 | 17.3 | –4.7 | |
| Liberal Democrats | Lindsey Macleod | 367 | 16.6 | –6.2 | |
| Turnout | |||||
| Green hold | |||||
| Green hold | |||||
| Green hold | |||||
Peacehaven East
| Party | Candidate | Votes | % | ±% | |
|---|---|---|---|---|---|
| Labour | Paul Davies | 620 | 58.4 | +21.3 | |
| Labour | Cathy Gallagher | 537 | 50.6 | +18.0 | |
| Conservative | Nigel Enever | 399 | 37.6 | –4.5 | |
| Conservative | Tara Moore | 324 | 30.5 | –4.2 | |
| Liberal Democrats | Emily Kramers | 73 | 6.9 | N/A | |
| Green | Lesley Orr | 65 | 6.1 | –12.3 | |
| Liberal Democrats | Helena Pickup | 61 | 5.7 | N/A | |
| Green | Anthony Shuster | 43 | 4.1 | –12.1 | |
| Turnout | |||||
| Labour gain from Conservative | |||||
| Labour hold | |||||
Peacehaven North
| Party | Candidate | Votes | % | ±% | |
|---|---|---|---|---|---|
| Labour | Ciarron Clarkson* | 555 | 52.0 | +24.1 | |
| Labour | Isobel Sharkey | 553 | 51.8 | N/A | |
| Conservative | Keira O'Neill* | 409 | 38.3 | –6.6 | |
| Conservative | Andy Smith | 389 | 36.4 | –9.1 | |
| Liberal Democrats | Joyce Bell | 65 | 6.1 | N/A | |
| Green | Liz Mansfield | 60 | 5.6 | –15.2 | |
| Green | Rikki Begley | 56 | 5.2 | –10.6 | |
| Liberal Democrats | David Stechler | 49 | 4.6 | N/A | |
| Turnout | |||||
| Labour gain from Conservative | |||||
| Labour gain from Conservative | |||||
Peacehaven West
| Party | Candidate | Votes | % | ±% | |
|---|---|---|---|---|---|
| Labour | Chris Collier* | 689 | 72.6 | N/A | |
| Labour | Nikki Fabry | 557 | 58.7 | N/A | |
| Conservative | Keiran Sefton | 390 | 41.1 | +6.1 | |
| Liberal Democrats | Liz Webb | 100 | 10.5 | –11.8 | |
| Green | Emily Slater | 71 | 7.5 | –16.1 | |
| Liberal Democrats | Fawzia Whittuck | 46 | 4.8 | N/A | |
| Green | Debra Vice-Holt | 44 | 4.6 | –12.9 | |
| Turnout | |||||
| Labour gain from Conservative | |||||
| Labour gain from Conservative | |||||
Plumpton, Streat, East Chiltington & St John (Without)
| Party | Candidate | Votes | % | ±% | |
|---|---|---|---|---|---|
| Liberal Democrats | Daniel Stewart-Roberts | 601 | 66.6 | +0.8 | |
| Conservative | Tam Large | 208 | 23.1 | +0.2 | |
| Green | John Oughton | 93 | 10.3 | +1.9 | |
| Majority | 393 | 43.5 | +0.6 | ||
| Turnout | 902 | ||||
| Liberal Democrats hold | Swing | ||||
Seaford Central
| Party | Candidate | Votes | % | ±% | |
|---|---|---|---|---|---|
| Liberal Democrats | Stephen Gauntlett* | 632 | 50.1 | +4.1 | |
| Liberal Democrats | Freddie Hoareau | 532 | 42.2 | +10.8 | |
| Conservative | Geoff Rutland* | 411 | 32.6 | –2.2 | |
| Labour | Elaine Sammarco | 297 | 23.6 | –6.1 | |
| Labour | Christopher Purser | 276 | 21.9 | N/A | |
| Green | Alice McCarthy Sommerville | 188 | 14.9 | –2.6 | |
| Green | Roy Francomb | 185 | 14.7 | –1.6 | |
| Turnout | |||||
| Liberal Democrats hold | |||||
| Liberal Democrats gain from Conservative | |||||
Seaford East
| Party | Candidate | Votes | % | ±% | |
|---|---|---|---|---|---|
| Green | Becky Francomb | 774 | 44.8 | +19.5 | |
| Green | Ezra Cohen | 764 | 44.3 | +25.3 | |
| Conservative | Sam Adenji* | 695 | 40.3 | –6.3 | |
| Conservative | Julian Peterson* | 583 | 33.8 | –11.4 | |
| Liberal Democrats | Lindsay Stirton | 225 | 13.0 | N/A | |
| Liberal Democrats | Maggie Wearmouth | 215 | 12.5 | N/A | |
| Reform UK | Alan Latham | 129 | 7.5 | N/A | |
| Independent | Lorraine Crawley | 68 | 3.9 | N/A | |
| Turnout | |||||
| Green gain from Conservative | |||||
| Green gain from Conservative | |||||
Seaford North
| Party | Candidate | Votes | % | ±% | |
|---|---|---|---|---|---|
| Green | James Meek | 584 | 41.9 | +16.4 | |
| Green | Roy Clay | 566 | 40.6 | +26.6 | |
| Conservative | James Lord* | 414 | 29.7 | –12.0 | |
| Liberal Democrats | Morag Everden | 409 | 29.4 | –3.7 | |
| Conservative | Sylvia Lord* | 409 | 29.4 | –9.6 | |
| Liberal Democrats | Sally Markwell | 404 | 29.0 | –2.5 | |
| Turnout | |||||
| Green gain from Conservative | |||||
| Green gain from Conservative | |||||
Seaford South
| Party | Candidate | Votes | % | ±% | |
|---|---|---|---|---|---|
| Liberal Democrats | Christine Brett* | 799 | 55.5 | +13.5 | |
| Liberal Democrats | Olivia Honeyman | 760 | 52.8 | +11.3 | |
| Conservative | Mark Brown | 422 | 29.3 | –13.4 | |
| Conservative | Melvyn Simmons | 349 | 24.2 | –11.3 | |
| Green | Miranda Suheimat | 218 | 15.1 | +2.1 | |
| Labour Co-op | Alun Tlusty-Sheen | 182 | 12.6 | –2.3 | |
| Green | Rachel Fryer | 150 | 10.4 | –2.1 | |
| Turnout | |||||
| Liberal Democrats hold | |||||
| Liberal Democrats gain from Conservative | |||||
Seaford West
| Party | Candidate | Votes | % | ±% | |
|---|---|---|---|---|---|
| Liberal Democrats | Christina Bristow | 851 | 50.6 | N/A | |
| Liberal Democrats | Lesley Boniface | 733 | 43.6 | N/A | |
| Conservative | Liz Boorman* | 663 | 39.4 | –15.6 | |
| Conservative | Bill Payne | 606 | 36.0 | –20.4 | |
| Green | Robert Burns | 219 | 13.0 | –28.5 | |
| Green | Gemma McFarlane | 155 | 9.2 | –17.6 | |
| Labour | Martin Waite | 139 | 8.3 | –15.3 | |
| Turnout | |||||
| Liberal Democrats gain from Conservative | |||||
| Liberal Democrats gain from Conservative | |||||
Wivelsfield
| Party | Candidate | Votes | % | ±% | |
|---|---|---|---|---|---|
| Green | William Coupland | 497 | 52.6 | +35.1 | |
| Conservative | Nancy Bikson* | 345 | 36.5 | –19.9 | |
| Liberal Democrats | Julie Salmon | 102 | 10.8 | –15.3 | |
| Majority | 152 | 16.1 | N/A | ||
| Turnout | |||||
| Green gain from Conservative | Swing | ||||
References
- "Notice of Election" (PDF). Lewes District Council. 20 March 2023. Retrieved 13 April 2023.
- "Lewes District Councillors". Lewes District Council. Retrieved 30 April 2023.
- "Statement of Persons Nominated" (PDF). Lewes District Council. 5 April 2023. Retrieved 13 April 2023.
| East Sussex County Council | |
|---|---|
| Brighton and Hove City Council | |
| Eastbourne Borough Council | |
| Hastings Borough Council | |
| Lewes District Council | |
| Rother District Council | |
| Wealden District Council | |
| Brighton Borough Council |
|
| Hove Borough Council |
|
| |
This article is issued from Wikipedia. The text is licensed under Creative Commons - Attribution - Sharealike. Additional terms may apply for the media files.