Wellington—Halton Hills (provincial electoral district)
Wellington—Halton Hills is a provincial electoral district in western Ontario, Canada. It elects one member to the Legislative Assembly of Ontario.
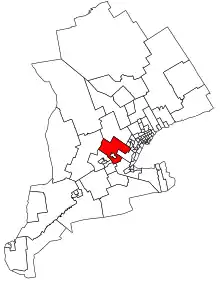 Wellington-Halton Hills in relation to other southern Ontario ridings | |||
| Provincial electoral district | |||
| Legislature | Legislative Assembly of Ontario | ||
| MPP |
Progressive Conservative | ||
| District created | 2004 | ||
| First contested | 2007 | ||
| Last contested | 2022 | ||
| Demographics | |||
| Population (2016) | 120,985 | ||
| Electors (2018) | 96,887 | ||
| Area (km²) | 1,514 | ||
| Pop. density (per km²) | 79.9 | ||
| Census division(s) | Wellington County, Halton | ||
| Census subdivision(s) | Guelph, Guelph/Eramosa, Puslinch, Erin, Centre Wellington, Halton Hills | ||
The riding, which was first contested in the 2007 provincial election, consists of the municipalities of Guelph/Eramosa, Puslinch, Erin, Centre Wellington and Halton Hills.
47.5% of the riding came from Halton, 25.2% came from Waterloo—Wellington, 16.3% came from Guelph—Wellington and 11% came from Dufferin—Peel—Wellington—Grey. Although it is counted as a Midwestern Ontario riding, the Halton Hills portion is part of the Greater Toronto Area.
Members of Provincial Parliament
| Wellington—Halton Hills | ||||
|---|---|---|---|---|
| Assembly | Years | Member | Party | |
| Riding created from Halton, Waterloo—Wellington, Guelph—Wellington and Dufferin—Peel—Wellington—Grey |
||||
| 39th | 2007–2011 | Ted Arnott | Progressive Conservative | |
| 40th | 2011–2014 | |||
| 41st | 2014–2018 | |||
| 42nd | 2018–2022 | |||
| 43rd | 2022–present | |||
Election results
| 2022 Ontario general election | ||||||||
|---|---|---|---|---|---|---|---|---|
| Party | Candidate | Votes | % | ±% | ||||
| Progressive Conservative | Ted Arnott | 24,049 | 49.59 | -4.41 | ||||
| New Democratic | Diane Ballantyne | 7,724 | 15.93 | -8.10 | ||||
| Green | Ryan Kahro | 7,002 | 14.44 | +5.80 | ||||
| Liberal | Tom Takacs | 6,920 | 14.27 | +1.49 | ||||
| New Blue | Stephen Kitras | 2,548 | 5.25 | |||||
| Consensus Ontario | Ron Patava | 250 | 0.52 | |||||
| Total valid votes | 48,493 | |||||||
| Total rejected, unmarked and declined ballots | 294 | |||||||
| Turnout | ||||||||
| Eligible voters | ||||||||
| Progressive Conservative hold | Swing | +1.85 | ||||||
| Source:Elections Ontario[1] | ||||||||
| 2018 Ontario general election | ||||||||
|---|---|---|---|---|---|---|---|---|
| Party | Candidate | Votes | % | ±% | ||||
| Progressive Conservative | Ted Arnott | 31,659 | 54.00 | +7.32 | ||||
| New Democratic | Diane Ballantyne | 14,087 | 24.03 | +9.88 | ||||
| Liberal | Jon Hurst | 7,492 | 12.78 | -16.34 | ||||
| Green | Dave Rodgers | 5,066 | 8.64 | -5.51 | ||||
| Libertarian | Jadon Pfeiffer | 320 | 0.55 | -1.73 | ||||
| Total valid votes | 58,624 | 100.0 | ||||||
| Total rejected, unmarked and declined ballots | ||||||||
| Turnout | 64.26 | |||||||
| Eligible voters | 91,228 | |||||||
| Progressive Conservative hold | Swing | -1.28 | ||||||
| Source: Elections Ontario[2] | ||||||||
| 2014 Ontario general election | ||||||||
|---|---|---|---|---|---|---|---|---|
| Party | Candidate | Votes | % | ±% | ||||
| Progressive Conservative | Ted Arnott | 22,600 | 46.68 | -8.94 | ||||
| Liberal | Daniel Zister | 14,095 | 29.12 | +2.29 | ||||
| New Democratic | Michael Carlucci | 6,848 | 14.15 | -0.30 | ||||
| Green | Dave Rodgers | 3,566 | 7.37 | +4.27 | ||||
| Libertarian | Jason Cousineau | 1,104 | 2.28 | |||||
| Freedom | Mitch Sproule | 198 | 0.40 | |||||
| Total valid votes | 48,411 | 100.00 | ||||||
| Progressive Conservative hold | Swing | -5.62 | ||||||
| Source: Elections Ontario[3] | ||||||||
| 2011 Ontario general election | ||||||||
|---|---|---|---|---|---|---|---|---|
| Party | Candidate | Votes | % | ±% | ||||
| Progressive Conservative | Ted Arnott | 23,495 | 55.62 | +6.46 | ||||
| Liberal | Moya Johnson | 11,334 | 26.83 | -3.56 | ||||
| New Democratic | Dale Hamilton | 6,106 | 14.45 | +5.52 | ||||
| Green | Raymond Dartsch | 1,309 | 3.10 | -7.15 | ||||
| Total valid votes | 42,244 | 100.00 | ||||||
| Total rejected, unmarked and declined ballots | 137 | 0.32 | ||||||
| Turnout | 42,381 | 51.11 | ||||||
| Eligible voters | 82,926 | |||||||
| Progressive Conservative hold | Swing | +5.01 | ||||||
| Source: Elections Ontario[4] | ||||||||
| 2007 Ontario general election | ||||||||
|---|---|---|---|---|---|---|---|---|
| Party | Candidate | Votes | % | ±% | ||||
| Progressive Conservative | Ted Arnott | 21,533 | 49.16 | -3.17 | ||||
| Liberal | Marg Bentley | 13,312 | 30.39 | -2.34 | ||||
| Green | Martin Lavictoire | 4,489 | 10.25 | |||||
| New Democratic | Noel Duignan | 3,914 | 8.94 | -0.25 | ||||
| Family Coalition | Giuseppe Gori | 555 | 1.27 | |||||
| Total valid votes | 43,803 | 100.00 | ||||||
| Progressive Conservative hold | Swing | -0.42 | ||||||
^ Change based on redistributed results
2007 electoral reform referendum
| 2007 Ontario electoral reform referendum | |||
|---|---|---|---|
| Side | Votes | % | |
| First Past the Post | 28,316 | 66.0 | |
| Mixed member proportional | 14,589 | 34.0 | |
| Total valid votes | 42,905 | 100.0 | |
Sources
- "Candidates in: Wellington—Halton Hills (115)". Elections Ontario. Retrieved May 6, 2022.
- "Summary of Valid Votes Cast for each Candidate" (PDF). Elections Ontario. p. 12. Retrieved 20 January 2019.
- Elections Ontario. "General Election Results by District, 099 Wellington-Halton Hills". Retrieved 13 June 2014.
- Elections Ontario (2011). "Official return from the records / Rapport des registres officiels - Wellington—Halton Hills" (PDF). Retrieved 2 June 2014.
This article is issued from Wikipedia. The text is licensed under Creative Commons - Attribution - Sharealike. Additional terms may apply for the media files.