Winnipeg South Centre
Winnipeg South Centre (French: Winnipeg-Centre-Sud) is a federal electoral district in Manitoba, Canada, that has been represented in the House of Commons of Canada from 1925 to 1979 and since 1988.
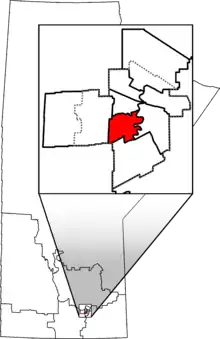 Winnipeg South Centre in relation to other Manitoba federal electoral districts as of the 2013 Representation Order. Dotted line shows Winnipeg city limits. | |||
| Federal electoral district | |||
| Legislature | House of Commons | ||
| MP | |||
| District created | 1987 | ||
| First contested | 1988 | ||
| Last contested | 2021 | ||
| District webpage | profile, map | ||
| Demographics | |||
| Population (2011)[1] | 90,711 | ||
| Electors (2015) | 67,988 | ||
| Area (km²)[2] | 46 | ||
| Pop. density (per km²) | 1,972 | ||
| Census division(s) | Division No. 11 | ||
| Census subdivision(s) | Winnipeg | ||
Geography
The district includes the neighbourhoods of Beaumont, Brockville, Buffalo, Chevrier, Crescent Park, Crescentwood, Earl Grey, Eby-Wentworth, Edgeland, Fort Garry, Grant Park, J.B. Mitchell, Linden Woods, Lord Roberts, Mathers, Maybank, McMillan, Osborne Village, Parker, Pembina Strip, Point Road, River Heights, Riverview, Rockwood, Roslyn, Sir John Franklin, Tuxedo, Wellington Crescent and Wildwood Park in the city of Winnipeg.
The Liberals tend to win their most votes in River Heights and adjacent neighbourhoods like Wellington Crescent. They are also strong in Roslyn. The Conservatives tend to do best in Tuxedo and Brockville. The NDP tends to do the best in Osborne Village.
Demographics
- According to the Canada 2021 Census[3]
Ethnic groups: 68.5% White, 8.3% Indigenous, 6.3% South Asian, 3.8% Black, 3.6% Filipino, 3.1% Chinese, 1.5% Latin American
Languages: 77.1% English, 2.5% French, 1.7% Tagalog, 1.6% Punjabi, 1.5% Spanish, 1.5% Mandarin, 1.5% German
Religions: 44.1% Christian (16.3% Catholic, 5.2% United Church, 3.7% Anglican, 1.9% Anabaptist, 1.9% Orthodox, 1.8% Lutheran, 13.3% Others), 6.4% Jewish, 2.7% Muslim, 2.3% Hindu, 1.8% Sikh, 40.8% No religion
Median income (2020): $44,000
Average income (2020): $63,850
History
The electoral district was originally created in 1924 from the ridings of Winnipeg South and Winnipeg Centre. Its first iteration was generally located west of the Red River and north of the Assiniboine River. In 1952, it gained parts the Rural Municipality (and later city) of St. James. In 1966, it gained parts the municipalities of Assiniboia, and Charleswood, and the Town of Tuxedo. By this time, the riding had moved further west, and crossed the Assiniboine.
In 1976, it was abolished with its territory transferred to the ridings of Winnipeg—Assiniboine and Winnipeg—St. James.
The electoral district was re-created in 1987 from parts of the redrawn ridings of St. Boniface and Winnipeg North Centre, and the abolished Winnipeg—Assiniboine and Winnipeg—Fort Garry. The new riding was almost entirely south of the Assiniboine River, except for Downtown Winnipeg, and had very little territory in common with the original Winnipeg South Centre.
The district's boundaries were redistributed in 1996 and 2003. The 2003 redistribution moved the riding entirely south of the Assiniboine for the first time.
This riding gained territory from Winnipeg South during the 2012 electoral redistribution.
Following the report from the 2022 electoral redistribution, the riding is set to lose the Tuxedo area to the new riding of Winnipeg West, while adding Whyte Ridge, Linden Ridge and West Fort Garry Industrial from Winnipeg South.
Members of Parliament
This riding has elected the following Members of Parliament:
Current Member of Parliament
Jim Carr represented Winnipeg South Centre from the 2015 election until his death in 2022, having been re-elected in 2019 and 2021.
Election results
1988–present
| 2021 Canadian federal election | ||||||||
|---|---|---|---|---|---|---|---|---|
| Party | Candidate | Votes | % | ±% | Expenditures | |||
| Liberal | Jim Carr | 22,214 | 45.55 | +0.54 | $84,273.45 | |||
| Conservative | Joyce Bateman | 13,566 | 27.82 | −1.89 | $83,919.18 | |||
| New Democratic | Julia Riddell | 10,064 | 20.64 | +2.94 | $12,522.59 | |||
| People's | Chase Wells | 1,352 | 2.77 | +1.65 | $1,885.74 | |||
| Green | Douglas Hemmerling | 1,341 | 2.75 | −3.51 | $21,799.84 | |||
| Communist | Cam Scott | 234 | 0.48 | N/A | N/A | |||
| Total valid votes/expense limit | 48,771 | 99.26 | $106,382.19 | |||||
| Total rejected ballots | 364 | 0.74 | +0.22 | |||||
| Turnout | 49,135 | 69.60 | -1.37 | |||||
| Eligible voters | 70,592 | |||||||
| Liberal hold | Swing | +1.22 | ||||||
| Source: Elections Canada[4][5] | ||||||||
| 2019 Canadian federal election | ||||||||
|---|---|---|---|---|---|---|---|---|
| Party | Candidate | Votes | % | ±% | Expenditures | |||
| Liberal | Jim Carr | 22,799 | 45.00 | −14.72 | $83,512.07 | |||
| Conservative | Joyce Bateman | 15,051 | 29.71 | +1.52 | $37,521.63 | |||
| New Democratic | Elizabeth Shearer | 8,965 | 17.70 | +8.74 | $8,170.86 | |||
| Green | James Beddome | 3,173 | 6.26 | +3.13 | $3,211.69 | |||
| People's | Jane MacDiarmid | 569 | 1.12 | – | $7,017.57 | |||
| Christian Heritage | Linda Marynuk | 104 | 0.21 | – | none listed | |||
| Total valid votes/expense limit | 50,661 | 99.48 | ||||||
| Total rejected ballots | 267 | 0.52 | +0.17 | |||||
| Turnout | 50,928 | 70.97 | -5.30 | |||||
| Eligible voters | 71,760 | |||||||
| Liberal hold | Swing | −8.12 | ||||||
| Source: Elections Canada[6][7] | ||||||||
| 2015 Canadian federal election | ||||||||
|---|---|---|---|---|---|---|---|---|
| Party | Candidate | Votes | % | ±% | Expenditures | |||
| Liberal | Jim Carr | 31,993 | 59.72 | +23.13 | $138,860.30 | |||
| Conservative | Joyce Bateman | 15,102 | 28.19 | −12.96 | $92,738.43 | |||
| New Democratic | Matt Henderson | 4,799 | 8.96 | −9.39 | $29,074.48 | |||
| Green | Andrew Park | 1,677 | 3.13 | −0.09 | $26,901.85 | |||
| Total valid votes/Expense limit | 53,571 | 99.65 | $203,341.22 | |||||
| Total rejected ballots | 188 | 0.35 | – | |||||
| Turnout | 53,759 | 76.27 | – | |||||
| Eligible voters | 70,487 | |||||||
| Liberal gain from Conservative | Swing | +18.05 | ||||||
| Source: Elections Canada[8][9] | ||||||||
| 2011 federal election redistributed results[10] | |||
|---|---|---|---|
| Party | Vote | % | |
| Conservative | 19,185 | 41.15 | |
| Liberal | 17,057 | 36.59 | |
| New Democratic | 8,554 | 18.35 | |
| Green | 1,502 | 3.22 | |
| Others | 321 | 0.69 | |
| 2011 Canadian federal election | ||||||||
|---|---|---|---|---|---|---|---|---|
| Party | Candidate | Votes | % | ±% | Expenditures | |||
| Conservative | Joyce Bateman | 15,506 | 38.82 | +2.56 | $72,590.37 | |||
| Liberal | Anita Neville | 14,784 | 37.02 | −5.25 | $79,128.33 | |||
| New Democratic | Dennis Lewycky | 7,945 | 19.89 | +5.78 | $15,656.19 | |||
| Green | Joshua McNeil | 1,383 | 3.46 | −3.89 | $1,586.80 | |||
| Independent | Matt Henderson | 218 | 0.55 | – | $129.79 | |||
| Independent | Lyndon B. Froese | 103 | 0.26 | – | $0.00 | |||
| Total valid votes/Expense limit | 39,939 | 99.62 | – | |||||
| Total rejected ballots | 154 | 0.38 | −0.00 | |||||
| Turnout | 40,093 | 69.04 | +3.36 | |||||
| Eligible voters | 58,075 | – | – | |||||
| Conservative gain from Liberal | Swing | +3.91 | ||||||
| 2008 Canadian federal election | ||||||||
|---|---|---|---|---|---|---|---|---|
| Party | Candidate | Votes | % | ±% | Expenditures | |||
| Liberal | Anita Neville | 16,438 | 42.27 | +3.02 | $74,911 | |||
| Conservative | Trevor Kennerd | 14,103 | 36.26 | +4.77 | $74,675 | |||
| New Democratic | Rachel Heinrichs | 5,490 | 14.12 | −7.69 | $10,465 | |||
| Green | Vere Scott | 2,860 | 7.35 | +2.90 | $1,774 | |||
| Total valid votes/Expense limit | 38,891 | 99.61 | $77,552 | |||||
| Total rejected ballots | 151 | 0.39 | +0.03 | |||||
| Turnout | 39,042 | 65.68 | -3.81 | |||||
| Eligible voters | 59,444 | – | – | |||||
| Liberal hold | Swing | -0.87 | ||||||
| 2006 Canadian federal election | ||||||||
|---|---|---|---|---|---|---|---|---|
| Party | Candidate | Votes | % | ±% | Expenditures | |||
| Liberal | Anita Neville | 16,296 | 39.25 | −7.35 | $71,377 | |||
| Conservative | Michael Richards | 13,077 | 31.49 | +4.47 | $72,385 | |||
| New Democratic | Mark Wasyliw | 9,055 | 21.81 | +0.56 | $19,492 | |||
| Green | Vere H. Scott | 1,848 | 4.45 | +0.58 | $1,237 | |||
| Progressive Canadian | Dale Swirsky | 934 | 2.25 | – | $11,137 | |||
| Independent | Jeffrey Anderson | 246 | 0.59 | – | $3,204 | |||
| Canadian Action | Magnus Thompson | 66 | 0.16 | −0.13 | $2,750 | |||
| Total valid votes | 41,522 | 99.64 | – | |||||
| Total rejected ballots | 150 | 0.36 | +0.00 | |||||
| Turnout | 41,672 | 69.49 | +6.85 | |||||
| Eligible voters | 59,971 | – | – | |||||
| Liberal hold | Swing | -5.91 | ||||||
| 2004 Canadian federal election | ||||||||
|---|---|---|---|---|---|---|---|---|
| Party | Candidate | Votes | % | ±% | Expenditures | |||
| Liberal | Anita Neville | 18,133 | 46.60 | +4.64 | $70,382 | |||
| Conservative | Raj Joshi | 10,516 | 27.02 | -10.49 | $62,453 | |||
| New Democratic | James Allum | 8,270 | 21.25 | +2.94 | $29,392 | |||
| Green | Ian Scott | 1,508 | 3.88 | – | $1,030 | |||
| Marijuana | Andy Caisse | 293 | 0.75 | – | – | |||
| Canadian Action | Magnus Thompson | 114 | 0.29 | – | $1,617 | |||
| Communist | Andrew Dalgliesh | 81 | 0.21 | – | $654 | |||
| Total valid votes | 38,915 | 99.64 | – | |||||
| Total rejected ballots | 139 | 0.36 | – | |||||
| Turnout | 39,054 | 62.64 | ||||||
| Eligible voters | 62,346 | – | – | |||||
| Conservative gain from Liberal | Swing | +7.57 | ||||||
Note: Change is based on redistributed results. Conservative vote is compared to the total of the Canadian Alliance vote and Progressive Conservative vote in 2000 election.
| 2000 federal election redistributed results[11] | |||
|---|---|---|---|
| Party | Vote | % | |
| Liberal | 15,992 | 41.96 | |
| Progressive Conservative | 10,100 | 26.50 | |
| New Democratic | 6,981 | 18.32 | |
| Canadian Alliance | 4,200 | 11.02 | |
| Others | 843 | 2.21 | |
| 2000 Canadian federal election | ||||||||
|---|---|---|---|---|---|---|---|---|
| Party | Candidate | Votes | % | ±% | ||||
| Liberal | Anita Neville | 15,231 | 40.46 | −15.42 | ||||
| Progressive Conservative | David Newman | 10,675 | 28.36 | +14.36 | ||||
| New Democratic | James Allum | 7,501 | 19.93 | +3.96 | ||||
| Alliance | Betty Granger | 3,210 | 8.53 | −3.92 | ||||
| Marijuana | Chris Buors | 640 | 1.70 | |||||
| Canadian Action | Magnus Thompson | 202 | 0.54 | |||||
| Communist | David Allison | 181 | 0.48 | |||||
| Total valid votes | 37,640 | 99.52 | ||||||
| Total rejected ballots | 181 | 0.48 | -0.35 | |||||
| Turnout | 37,821 | 62.54 | -2.38 | |||||
| Eligible voters | 60,471 | – | – | |||||
| Liberal hold | Swing | -14.89 | ||||||
Note: Canadian Alliance vote is compared to the Reform vote in 1997 election.
| 1997 Canadian federal election | ||||||||
|---|---|---|---|---|---|---|---|---|
| Party | Candidate | Votes | % | ±% | ||||
| Liberal | Lloyd Axworthy | 20,006 | 55.89 | −5.55 | ||||
| New Democratic | Sara Malabar | 5,717 | 15.97 | +7.63 | ||||
| Progressive Conservative | Andrea Rolstone | 5,011 | 14.00 | +4.73 | ||||
| Reform | Gary Hollingshead | 4,457 | 12.45 | −0.10 | ||||
| Natural Law | Ron Decter | 224 | 0.63 | +0.09 | ||||
| Independent | Jim Blomquist | 202 | 0.56 | |||||
| Marxist–Leninist | Karen Naylor | 180 | 0.50 | +0.32 | ||||
| Total valid votes | 35,797 | 99.17 | ||||||
| Total rejected ballots | 299 | 0.83 | ||||||
| Turnout | 36,096 | 64.92 | ||||||
| Eligible voters | 55,600 | – | – | |||||
| Liberal hold | Swing | -6.59 | ||||||
| 1993 Canadian federal election | ||||||||
|---|---|---|---|---|---|---|---|---|
| Party | Candidate | Votes | % | ±% | ||||
| Liberal | Lloyd Axworthy | 25,881 | 61.44 | +3.01 | ||||
| Reform | Vern A. Hannah | 5,288 | 12.55 | +10.82 | ||||
| Progressive Conservative | Mike Radcliffe | 3,903 | 9.26 | −19.64 | ||||
| New Democratic | Lloyd Penner | 3,512 | 8.34 | −2.01 | ||||
| National | Bill Loewen | 3,099 | 7.36 | |||||
| Natural Law | Elizabeth Innes | 225 | 0.53 | |||||
| Libertarian | Clancy Smith | 89 | 0.21 | −0.13 | ||||
| Independent | Karen Naylor | 76 | 0.18 | |||||
| Canada Party | Ben J. Fulawka | 54 | 0.13 | |||||
| Total valid votes | 42,127 | 100.0 | ||||||
| Liberal hold | Swing | -3.90 | ||||||
| 1988 Canadian federal election | ||||||||
|---|---|---|---|---|---|---|---|---|
| Party | Candidate | Votes | % | |||||
| Liberal | Lloyd Axworthy | 26,191 | 58.42 | |||||
| Progressive Conservative | Garth Dawley | 12,960 | 28.91 | |||||
| New Democratic | Les Campbell | 4,637 | 10.34 | |||||
| Reform | Ross Malabar | 777 | 1.73 | |||||
| Libertarian | Clancy Smith | 154 | 0.34 | |||||
| Independent | Ken Kalturnyk | 111 | 0.25 | |||||
| Total valid votes | 44,830 | 100.0 | ||||||
1925–1979
| 1974 Canadian federal election | ||||||||
|---|---|---|---|---|---|---|---|---|
| Party | Candidate | Votes | % | ±% | ||||
| Progressive Conservative | Dan McKenzie | 32,277 | 57.1 | +11.9 | ||||
| Liberal | Doug McEwen | 15,956 | 28.2 | −8.1 | ||||
| New Democratic | Andy Robertson | 7,823 | 13.8 | −4.7 | ||||
| Social Credit | Monty A. McDonald | 365 | 0.6 | |||||
| Marxist–Leninist | Marnie Frain | 102 | 0.2 | |||||
| Total valid votes | 56,523 | 100.0 | ||||||
| 1972 Canadian federal election | ||||||||
|---|---|---|---|---|---|---|---|---|
| Party | Candidate | Votes | % | ±% | ||||
| Progressive Conservative | Dan McKenzie | 25,550 | 45.2 | +16.3 | ||||
| Liberal | E. B. Osler | 20,516 | 36.3 | −15.5 | ||||
| New Democratic | Harvey H. Moats | 10,460 | 18.5 | +0.6 | ||||
| Total valid votes | 56,526 | 100.0 | ||||||
| 1968 Canadian federal election | ||||||||
|---|---|---|---|---|---|---|---|---|
| Party | Candidate | Votes | % | ±% | ||||
| Liberal | E. B. Osler | 23,775 | 51.8 | +15.5 | ||||
| Progressive Conservative | Duff Roblin | 13,268 | 28.9 | −12.9 | ||||
| New Democratic | Frances Thompson | 8,240 | 17.9 | −1.8 | ||||
| Independent Conservative | John McDowell | 632 | 1.4 | |||||
| Total valid votes | 45,915 | 100.0 | ||||||
| 1965 Canadian federal election | ||||||||
|---|---|---|---|---|---|---|---|---|
| Party | Candidate | Votes | % | ±% | ||||
| Progressive Conservative | Gordon Churchill | 15,296 | 41.8 | −0.7 | ||||
| Liberal | Fred Douglas | 13,262 | 36.3 | −3.2 | ||||
| New Democratic | Philip Petursson | 7,234 | 19.8 | +4.8 | ||||
| Social Credit | Walter Hatch | 764 | 2.1 | −0.9 | ||||
| Total valid votes | 36,556 | 100.0 | ||||||
| 1963 Canadian federal election | ||||||||
|---|---|---|---|---|---|---|---|---|
| Party | Candidate | Votes | % | ±% | ||||
| Progressive Conservative | Gordon Churchill | 17,092 | 42.6 | −0.4 | ||||
| Liberal | Fred Douglas | 15,849 | 39.5 | +2.3 | ||||
| New Democratic | Alistair Stewart | 6,011 | 15.0 | −1.5 | ||||
| Social Credit | Harold Bathgate | 1,182 | 2.9 | −0.4 | ||||
| Total valid votes | 40,134 | 100.0 | ||||||
| 1962 Canadian federal election | ||||||||
|---|---|---|---|---|---|---|---|---|
| Party | Candidate | Votes | % | ±% | ||||
| Progressive Conservative | Gordon Churchill | 16,547 | 43.0 | −23.6 | ||||
| Liberal | Ed Russenholt | 14,306 | 37.2 | +18.1 | ||||
| New Democratic | A.N. Robertson | 6,357 | 16.5 | +2.2 | ||||
| Social Credit | Asta Oddson | 1,298 | 3.4 | |||||
| Total valid votes | 38,508 | 100.0 | ||||||
Note: NDP vote is compared to CCF vote in 1958 election.
| 1958 Canadian federal election | ||||||||
|---|---|---|---|---|---|---|---|---|
| Party | Candidate | Votes | % | ±% | ||||
| Progressive Conservative | Gordon Churchill | 27,722 | 66.6 | +16.5 | ||||
| Liberal | Ronald Gillies | 7,927 | 19.0 | –6.2 | ||||
| Co-operative Commonwealth | Gordon Fines | 5,975 | 14.4 | –3.5 | ||||
| Total valid votes | 41,624 | 100.0 | ||||||
| 1953 Canadian federal election | ||||||||
|---|---|---|---|---|---|---|---|---|
| Party | Candidate | Votes | % | ±% | ||||
| Progressive Conservative | Gordon Churchill | 12,489 | 42.7 | −0.9 | ||||
| Liberal | A.W. Hanks | 9,752 | 33.3 | −4.9 | ||||
| Co-operative Commonwealth | Gordon R. Fines | 6,506 | 22.2 | +4.1 | ||||
| Labor–Progressive | Roland Penner | 504 | 1.7 | |||||
| Total valid votes | 29,251 | 100.0 | ||||||
| Canadian federal by-election, 25 June 1951 | ||||||||
|---|---|---|---|---|---|---|---|---|
| Party | Candidate | Votes | % | ±% | ||||
| On Mr. Maybank's resignation, 30 April 1951 | ||||||||
| Progressive Conservative | Gordon Churchill | 6,009 | 43.6 | +19.2 | ||||
| Liberal | Norman Wright | 5,273 | 38.3 | −16.4 | ||||
| Co-operative Commonwealth | Charles Biesick | 2,497 | 18.1 | −2.8 | ||||
| Total valid votes | 13,779 | 100.0 | ||||||
| 1949 Canadian federal election | ||||||||
|---|---|---|---|---|---|---|---|---|
| Party | Candidate | Votes | % | ±% | ||||
| Liberal | Ralph Maybank | 14,747 | 54.7 | +10.7 | ||||
| Progressive Conservative | Gordon Minto Churchill | 6,593 | 24.4 | +1.7 | ||||
| Co-operative Commonwealth | Andrew N. Robertson | 5,632 | 20.9 | −12.4 | ||||
| Total valid votes | 26,972 | 100.0 | ||||||
| 1945 Canadian federal election | ||||||||
|---|---|---|---|---|---|---|---|---|
| Party | Candidate | Votes | % | ±% | ||||
| Liberal | Ralph Maybank | 16,389 | 44.0 | −10.5 | ||||
| Co-operative Commonwealth | Lloyd Cleworth Stinson | 12,393 | 33.3 | +17.7 | ||||
| Progressive Conservative | Frank Edward Womersley | 8,461 | 22.7 | −7.2 | ||||
| Total valid votes | 37,243 | 100.0 | ||||||
Note: Progressive Conservative vote is compared to "National Government" vote in 1940 election.
| 1940 Canadian federal election | ||||||||
|---|---|---|---|---|---|---|---|---|
| Party | Candidate | Votes | % | ±% | ||||
| Liberal | Ralph Maybank | 19,486 | 54.5 | +18.1 | ||||
| National Government | William Walker Kennedy | 10,698 | 29.9 | −0.4 | ||||
| Co-operative Commonwealth | John Julius Swanson | 5,576 | 15.6 | −5.6 | ||||
| Total valid votes | 35,760 | 100.0 | ||||||
Note: "National Government" vote is compared to Conservative vote in 1935 election.
| 1935 Canadian federal election | ||||||||
|---|---|---|---|---|---|---|---|---|
| Party | Candidate | Votes | % | ±% | ||||
| Liberal | Ralph Maybank | 11,264 | 36.4 | −7.6 | ||||
| Conservative | William Walker Kennedy | 9,382 | 30.3 | −25.7 | ||||
| Co-operative Commonwealth | Stanley Knowles | 6,573 | 21.2 | |||||
| Reconstruction | Alfred James Susans | 2,642 | 8.5 | |||||
| Social Credit | Arthur Brown | 1,114 | 3.6 | |||||
| Total valid votes | 30,975 | 100.0 | ||||||
| 1930 Canadian federal election | ||||||||
|---|---|---|---|---|---|---|---|---|
| Party | Candidate | Votes | % | ±% | ||||
| Conservative | William Walker Kennedy | 17,355 | 56.0 | +7.2 | ||||
| Liberal | Joseph Thorarinn Thorson | 13,637 | 44.0 | −7.2 | ||||
| Total valid votes | 30,992 | 100.0 | ||||||
| 1926 Canadian federal election | ||||||||
|---|---|---|---|---|---|---|---|---|
| Party | Candidate | Votes | % | ±% | ||||
| Liberal | Joseph Thorarinn Thorson | 12,315 | 51.2 | +20.0 | ||||
| Conservative | William Walker Kennedy | 11,737 | 48.8 | −4.1 | ||||
| Total valid votes | 24,052 | 100.0 | ||||||
| 1925 Canadian federal election | ||||||||
|---|---|---|---|---|---|---|---|---|
| Party | Candidate | Votes | % | |||||
| Conservative | William Walker Kennedy | 12,094 | 52.9 | |||||
| Liberal | Joseph Fergus Davidson | 7,132 | 31.2 | |||||
| Labour | Alexander Henry | 3,643 | 15.9 | |||||
| Total valid votes | 22,869 | 100.0 | ||||||
Student vote results
| 2019 Canadian federal election | ||||||||
|---|---|---|---|---|---|---|---|---|
| Party | Candidate | Votes | % | ±% | ||||
| Liberal | Jim Carr | 937 | 27.01 | −26.05 | ||||
| New Democratic | Elizabeth Shearer | 934 | 26.92 | +12.34 | ||||
| Conservative | Joyce Bateman | 765 | 22.05 | −0.08 | ||||
| Green | James Beddome | 598 | 17.24 | +7.01 | ||||
| People's | Jane MacDiarmid | 150 | 4.32 | – | ||||
| Christian Heritage | Linda Marynuk | 85 | 2.45 | – | ||||
| Liberal hold | Swing | −26.05 | ||||||
| Source: Student Votes Canada[12][13] | ||||||||
| 2015 Canadian federal election | ||||||||
|---|---|---|---|---|---|---|---|---|
| Party | Candidate | Votes | % | ±% | ||||
| Liberal | Jim Carr | 2,199 | 53.06 | +25.56 | ||||
| Conservative | Joyce Bateman | 917 | 22.13 | −3.77 | ||||
| New Democratic | Matt Henderson | 604 | 14.58 | −9.92 | ||||
| Green | Andrew Park | 424 | 10.23 | −4.07 | ||||
| Liberal hold | Swing | +25.56 | ||||||
| Source: Student Votes Canada[14][15] | ||||||||
| 2011 Canadian federal election | ||||||||
|---|---|---|---|---|---|---|---|---|
| Party | Candidate | Votes | % | |||||
| Liberal | Anita Neville | 426 | 27.5 | |||||
| Conservative | Joyce Bateman | 402 | 25.9 | |||||
| New Democratic | Dennis Lewycky | 380 | 24.5 | |||||
| Green | Joshua McNeil | 222 | 14.3 | |||||
| Independent | Matt Henderson | 95 | 6.12 | |||||
| Independent | Lyndon B. Froese | 26 | 1.67 | |||||
| Source: Student Votes Canada[16][17] | ||||||||
See also
References
- "Winnipeg South Centre (Code 46014) Census Profile". 2011 census. Government of Canada - Statistics Canada. Retrieved March 3, 2011.
- Riding history for Winnipeg South Centre (1924–1976) from the Library of Parliament
- Riding history for Winnipeg South Centre (1987–2003) from the Library of Parliament
- Riding history for Winnipeg South Centre (2003– ) from the Library of Parliament
- Expenditures - 2008
- Expenditures - 2004
Notes
- Statistics Canada: 2012
- Statistics Canada: 2012
- "Census Profile, 2021 Census, Statistics Canada".
- "forty-fourth general election 2021 — Poll-by-poll results". Elections Canada. Retrieved December 23, 2022.
- "Candidate Campaign Returns". Elections Canada. Retrieved December 13, 2022.
- "forty-third general election 2019 — Poll-by-poll results". Elections Canada. Retrieved December 23, 2022.
- "Candidate Campaign Returns". Elections Canada. Retrieved September 7, 2020.
- Elections Canada – forty-second general election 2015 — Poll-by-poll results
- Elections Canada – Preliminary Election Expenses Limits for Candidates
- Pundits' Guide to Canadian Elections
- Election Prediction Project
- "Election Night Results". Elections Canada. Retrieved November 9, 2019.
- "Student Votes Canada". Student Votes Canada. Retrieved August 27, 2021.
- Elections Canada – Confirmed candidates for Winnipeg South Centre, 30 September 2015
- Student Votes Canada
- Elections Canada – Confirmed candidates for Winnipeg South Centre, 30 September 2015
- Student Votes Canada