South Okanagan—West Kootenay
South Okanagan—West Kootenay (French: Okanagan-Sud—Kootenay-Ouest) is a federal electoral district in British Columbia. It encompasses a portion of British Columbia previously included in the electoral districts of British Columbia Southern Interior (58%), Kootenay—Columbia (3%), and Okanagan—Coquihalla (39%).[2]
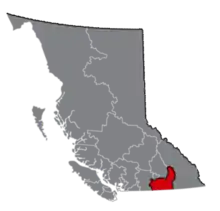 South Okanagan—West Kootenay in relation to other British Columbia federal electoral districts | |||
| Federal electoral district | |||
| Legislature | House of Commons | ||
| MP |
New Democratic | ||
| District created | 2013 | ||
| First contested | 2015 | ||
| Last contested | 2021 | ||
| District webpage | profile, map | ||
| Demographics | |||
| Population (2011)[1] | 112,096 | ||
| Electors (2011) | 88,519 | ||
| Area (km²)[1] | 18,139 | ||
| Pop. density (per km²) | 6.2 | ||
| Census division(s) | Central Kootenay, Kootenay Boundary, Okanagan-Similkameen | ||
| Census subdivision(s) | Castlegar, Central Kootenay H, Grand Forks, Okanagan-Similkameen C, Okanagan-Similkameen D, Oliver, Osoyoos, Penticton, Rossland, Trail | ||
South Okanagan—West Kootenay was created by the 2012 federal electoral boundaries redistribution and was legally defined in the 2013 representation order. It came into effect upon the call of the 42nd Canadian federal election, scheduled for October 2015.[3]
Demographics
| Panethnic group |
2021[4] | 2016[5] | 2011[6] | |||||||||||
|---|---|---|---|---|---|---|---|---|---|---|---|---|---|---|
| Pop. | % | Pop. | % | Pop. | % | |||||||||
| European[lower-alpha 1] | 103,605 | 86% | 97,630 | 87.45% | 98,150 | 89.87% | ||||||||
| Indigenous | 8,295 | 6.89% | 7,635 | 6.84% | 6,175 | 5.65% | ||||||||
| South Asian | 3,640 | 3.02% | 2,850 | 2.55% | 2,420 | 2.22% | ||||||||
| East Asian[lower-alpha 2] | 1,640 | 1.36% | 1,385 | 1.24% | 1,045 | 0.96% | ||||||||
| Southeast Asian[lower-alpha 3] | 1,375 | 1.14% | 1,015 | 0.91% | 620 | 0.57% | ||||||||
| Latin American | 665 | 0.55% | 310 | 0.28% | 195 | 0.18% | ||||||||
| African | 660 | 0.55% | 470 | 0.42% | 400 | 0.37% | ||||||||
| Middle Eastern[lower-alpha 4] | 185 | 0.15% | 80 | 0.07% | 95 | 0.09% | ||||||||
| Other[lower-alpha 5] | 405 | 0.34% | 270 | 0.24% | 135 | 0.12% | ||||||||
| Total responses | 120,470 | 97.56% | 111,640 | 97.34% | 109,215 | 97.43% | ||||||||
| Total population | 123,487 | 100% | 114,695 | 100% | 112,096 | 100% | ||||||||
| Notes: Totals greater than 100% due to multiple origin responses. Demographics based on 2012 Canadian federal electoral redistribution riding boundaries. | ||||||||||||||
Members of Parliament
This riding has elected the following members of the House of Commons of Canada:
| Parliament | Years | Member | Party | |
|---|---|---|---|---|
| South Okanagan—West Kootenay Riding created from British Columbia Southern Interior, Kootenay—Columbia and Okanagan—Coquihalla |
||||
| 42nd | 2015–2019 | Richard Cannings | New Democratic | |
| 43rd | 2019–2021 | |||
| 44th | 2021–present | |||
Election results
Graph of election results in South Okanagan—West Kootenay (minor parties that never got 2% of the vote or didn't run consistently are omitted)
| 2021 Canadian federal election | ||||||||
|---|---|---|---|---|---|---|---|---|
| Party | Candidate | Votes | % | ±% | Expenditures | |||
| New Democratic | Richard Cannings | 27,595 | 41.3 | +4.9 | ||||
| Conservative | Helena Konanz | 23,675 | 35.5 | +0.3 | ||||
| Liberal | Ken Robertson | 8,159 | 12.2 | -5.0 | ||||
| People's | Sean Taylor | 4,866 | 7.3 | +4.9 | ||||
| Green | Tara Howse | 2,485 | 3.7 | -4.6 | ||||
| Total valid votes | 66,780 | 99.4 | ||||||
| Total rejected ballots | 434 | 0.6 | ||||||
| Turnout | 67,214 | 65.6 | ||||||
| Eligible voters | 102,433 | |||||||
| New Democratic hold | Swing | +2.3 | ||||||
| Source: Elections Canada[7] | ||||||||
| 2019 Canadian federal election | ||||||||
|---|---|---|---|---|---|---|---|---|
| Party | Candidate | Votes | % | ±% | Expenditures | |||
| New Democratic | Richard Cannings | 24,809 | 36.4 | -0.88 | $121,393.67 | |||
| Conservative | Helena Konanz | 24,053 | 35.2 | +5.36 | none listed | |||
| Liberal | Connie Denesiuk | 11,705 | 17.2 | -10.93 | $60,410.04 | |||
| Green | Tara-Lyn Howse | 5,672 | 8.3 | +4.11 | $10,551.96 | |||
| People's | Sean Taylor | 1,638 | 2.4 | $6,237.32 | ||||
| Independent | Carolina Marie Hopkins | 359 | 0.2 | $77.17 | ||||
| Total valid votes/expense limit | 68,196 | 100.0 | ||||||
| Total rejected ballots | 381 | |||||||
| Turnout | 68,577 | 69.56 | ||||||
| Eligible voters | 98,589 | |||||||
| New Democratic hold | Swing | -3.12 | ||||||
| Source: Elections Canada[8][9] | ||||||||
| 2015 Canadian federal election | ||||||||
|---|---|---|---|---|---|---|---|---|
| Party | Candidate | Votes | % | ±% | Expenditures | |||
| New Democratic | Richard Cannings | 24,823 | 37.28 | -2.16 | $120,417.22 | |||
| Conservative | Marshall Neufeld | 19,871 | 29.84 | -14.93 | $156,966.44 | |||
| Liberal | Connie Denesiuk | 18,732 | 28.13 | +21.03 | $26,034.25 | |||
| Green | Samantha Troy | 2,792 | 4.19 | -3.94 | $153.48 | |||
| Independent | Brian Gray | 376 | 0.56 | – | $115.36 | |||
| Total valid votes/expense limit | 66,594 | 100.00 | $247,730.42 | |||||
| Total rejected ballots | 216 | 0.32 | – | |||||
| Turnout | 66,810 | 73.67 | – | |||||
| Eligible voters | 90,694 | |||||||
| New Democratic notional gain from Conservative | Swing | +6.39 | ||||||
| Source: Elections Canada[10][11] | ||||||||
| 2011 federal election redistributed results[12] | |||
|---|---|---|---|
| Party | Vote | % | |
| Conservative | 24,846 | 44.77 | |
| New Democratic | 21,886 | 39.44 | |
| Green | 4,512 | 8.13 | |
| Liberal | 3,942 | 7.10 | |
| Others | 308 | 0.56 | |
Notes
- Statistic includes all persons that did not make up part of a visible minority or an indigenous identity.
- Statistic includes total responses of "Chinese", "Korean", and "Japanese" under visible minority section on census.
- Statistic includes total responses of "Filipino" and "Southeast Asian" under visible minority section on census.
- Statistic includes total responses of "West Asian" and "Arab" under visible minority section on census.
- Statistic includes total responses of "Visible minority, n.i.e." and "Multiple visible minorities" under visible minority section on census.
References
- Statistics Canada: 2012
- Final Report – British Columbia
- Timeline for the Redistribution of Federal Electoral Districts
- Government of Canada, Statistics Canada (October 26, 2022). "Census Profile, 2021 Census of Population". www12.statcan.gc.ca. Retrieved February 15, 2023.
- Government of Canada, Statistics Canada (October 27, 2021). "Census Profile, 2016 Census". www12.statcan.gc.ca. Retrieved February 15, 2023.
- Government of Canada, Statistics Canada (November 27, 2015). "NHS Profile". www12.statcan.gc.ca. Retrieved February 15, 2023.
- "List of confirmed candidates – September 20, 2021 Federal Election". Elections Canada. Retrieved September 2, 2021.
- "List of confirmed candidates". Elections Canada. Retrieved October 4, 2019.
- "Election Night Results". Elections Canada. Retrieved November 16, 2019.
- Elections Canada – Confirmed candidates for South Okanagan—West Kootenay, 30 September 2015
- Elections Canada – Preliminary Election Expenses Limits for Candidates
- Pundits' Guide to Canadian Elections
This article is issued from Wikipedia. The text is licensed under Creative Commons - Attribution - Sharealike. Additional terms may apply for the media files.