Ajax (electoral district)
Ajax is a federal electoral district in the Durham Region of Ontario.
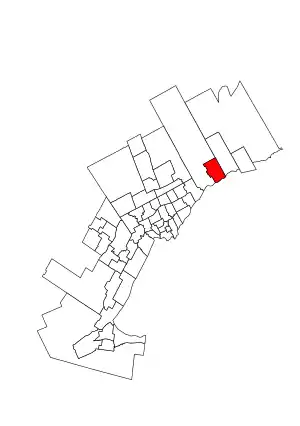 Ajax in relation to other Greater Toronto Area districts | |||
| Coordinates: | 43°51′16″N 79°03′36″W Location of the federal constituency office (as of 7 May 2016) | ||
| Federal electoral district | |||
| Legislature | House of Commons | ||
| MP |
Liberal | ||
| District created | 2013 | ||
| First contested | 2015 | ||
| Last contested | 2021 | ||
| District webpage | profile, map | ||
| Demographics | |||
| Population (2021)[1] | 126,666 | ||
| Electors (2015) | 83,542 | ||
| Area (km²)[2] | 67.00 | ||
| Pop. density (per km²) | 1,890.5 | ||
| Census division(s) | Durham | ||
| Census subdivision(s) | Ajax | ||
Ajax was created by the 2012 riding redistribution from the portion of Ajax—Pickering[3] consisting of the entire town of Ajax, Ontario, and was legally defined in the 2013 representation order. It came into effect in time for the 2015 Canadian federal election.[4]
Demographics
According to the 2021 Canada Census[5]
Ethnic groups: 34.1% White, 26.2% South Asian, 16.8% Black, 5.3% Filipino, 3.0% West Asian, 3.0% Chinese, 2.0% Arab, 1.3% Latin American, 1.3% Indigenous
Languages: 64.8% English, 5.0% Tamil, 3.7% Urdu, 2.2% Tagalog, 1.5% Dari, 1.2% Gujarati, 1.2% Arabic, 1.1% French, 1.0% Punjabi, 1.0% Spanish, 1.0% Mandarin
Religions: 50.8% Christian (22.2% Catholic, 3.7% Pentecostal, 3.5% Anglican, 2.5% Christian Orthodox, 2.1% United Church, 1.3% Baptist, 1.1% Presbyterian, 14.4% None), 14.1% Muslim, 11.6% Hindu, 1.3% Sikh, 20.8% None
Median income: $42,400 (2020)
Average income: $54,300 (2020)
Members of Parliament
This riding has elected the following members of the House of Commons of Canada:
| Parliament | Years | Member | Party | |
|---|---|---|---|---|
| Riding created from Ajax—Pickering | ||||
| 42nd | 2015–2019 | Mark Holland | Liberal | |
| 43rd | 2019–2021 | |||
| 44th | 2021–present | |||
Election results
| 2021 Canadian federal election | ||||||||
|---|---|---|---|---|---|---|---|---|
| Party | Candidate | Votes | % | ±% | Expenditures | |||
| Liberal | Mark Holland | 28,279 | 56.83 | –0.85 | ||||
| Conservative | Arshad Awan | 13,237 | 26.60 | +0.60 | ||||
| New Democratic | Monique Hughes | 6,988 | 14.04 | +2.51 | ||||
| Green | Leigh Paulseth | 1,254 | 2.52 | –0.82 | ||||
| Total valid votes/expense limit | 49,658 | 100.00 | – | $120,937.77 | ||||
| Total rejected ballots | 525 | 1.04 | +0.25 | |||||
| Turnout | 50,283 | 54.12 | –11.86 | |||||
| Eligible voters | 92,907 | |||||||
| Liberal hold | Swing | –0.73 | ||||||
| Source: Elections Canada[6][7] | ||||||||
| 2019 Canadian federal election | ||||||||
|---|---|---|---|---|---|---|---|---|
| Party | Candidate | Votes | % | ±% | Expenditures | |||
| Liberal | Mark Holland | 35,198 | 57.68 | +1.81 | $64,483.26 | |||
| Conservative | Tom Dingwall | 15,864 | 26.00 | -8.41 | $102,214.59 | |||
| New Democratic | Shokat Malik | 7,033 | 11.53 | +3.30 | $9,641.03 | |||
| Green | Maia Knight | 2,040 | 3.34 | +1.94 | $1,882.83 | |||
| People's | Susanna Russo | 588 | 0.96 | $3,679.53 | ||||
| Independent | Allen Keith Hadley | 186 | 0.30 | $1,441.93 | ||||
| Independent | Intab Ali | 111 | 0.18 | none listed | ||||
| Total valid votes/expense limit | 61,020 | 99.21 | ||||||
| Total rejected ballots | 487 | 0.79 | +0.43 | |||||
| Turnout | 61,507 | 65.98 | -0.31 | |||||
| Eligible voters | 93,215 | |||||||
| Liberal hold | Swing | +5.11 | ||||||
| Source: Elections Canada[8][9] | ||||||||
| 2015 Canadian federal election | ||||||||
|---|---|---|---|---|---|---|---|---|
| Party | Candidate | Votes | % | ±% | Expenditures | |||
| Liberal | Mark Holland | 31,458 | 55.87 | +17.94 | $98,658.57 | |||
| Conservative | Chris Alexander | 19,374 | 34.41 | −9.82 | $154,560.57 | |||
| New Democratic | Stephanie Brown | 4,630 | 8.22 | −6.78 | $3,065.75 | |||
| Green | Jeff Hill | 788 | 1.40 | −1.32 | $717.00 | |||
| United | Bob Kesic | 57 | 0.10 | -0.02 | – | |||
| Total valid votes/Expense limit | 56,307 | 99.64 | $222,192.40 | |||||
| Total rejected ballots | 206 | 0.36 | – | |||||
| Turnout | 56,513 | 66.29 | – | |||||
| Eligible voters | 85,251 | |||||||
| Liberal gain from Conservative | Swing | +13.88 | ||||||
| Source: Elections Canada[10][11][12] | ||||||||
| 2011 federal election poll-by-poll redistribution[13] | |||
|---|---|---|---|
| Party | Vote | % | |
| Conservative | 19,535 | 44.23 | |
| Liberal | 16,753 | 37.93 | |
| New Democratic | 6,624 | 15.00 | |
| Green | 1,200 | 2.72 | |
| United | 53 | 0.12 | |
References
- "Census Profile, 2021 Census". Ottawa: Statistics Canada. 2022. Retrieved February 9, 2022.
- Statistics Canada: 2017
- Final Report – Ontario
- Timeline for the Redistribution of Federal Electoral Districts
- Government of Canada, Statistics Canada (February 9, 2022). "Profile table, Census Profile, 2021 Census of Population - Ajax [Federal electoral district (2013 Representation Order)], Ontario". www12.statcan.gc.ca. Retrieved March 10, 2023.
- "Election Night Results — Ajax". Elections Canada. Retrieved December 19, 2021.
- "Final Election Expenses Limits for Candidates — 44th Canadian Federal Election". Elections Canada. Retrieved December 19, 2021.
- "List of confirmed candidates". Elections Canada. Retrieved October 3, 2019.
- "Official Voting Results". Elections Canada. Retrieved August 14, 2021.
- Elections Canada – Confirmed candidates for Ajax, 30 September 2015
- Elections Canada – Preliminary Election Expenses Limits for Candidates Archived 2016-03-04 at the Wayback Machine
- "Official Voting Results". Elections Canada. Retrieved August 14, 2021.
- Pundits' Guide to Canadian Elections